Practice forecasting in Cubiko allows you to determine a variety of outcomes that could be possible, based on the information you provide.
This metric can be found on the Financial Insights > Practice forecasting > Billings needed to break even tab

The forecaster uses a combination of the following data, in order to calculate the metrics you see on this page:
- Hours worked
- Billings trends and history
- Service fees per user (set by you)
- Weekly income and expenses (set by you, outside of billings)
- Your practice budgets (set by you)
NOTE: Where we indicate that data needs to be set by you, this information needs to be added to your Settings. If you have not added this information to Settings, that's ok, you can still use the forecaster by manually entering the information as outlined below. However, if you would rather have it here every time you look at these metrics, it is best to enter it in Settings. For more help and guidance on how to do this, click here.
The sections included in this article relating to the Practice forecasting metrics in the Billings needed to break even tab are:
- Weekly income
- Weekly expenses
- Billings needed to break even
- Billings target
- Appts per hour to break even next week
- Apps per hour forecasting
- Session hours to break even next week
- Session hours forecasting
- Billings per appt to break even next week
- Billings per appt forecasting
Weekly income
This metric shows the actual weekly income earned for your practice outside of your practice billings. This amount could include room rental or hire and your PIP and WIP income.
This amount is based on the information entered in your Settings. If you haven't entered this information, you can enter a value manually using the text box in this metric as below.

NOTE: Ensure you divide your PIP or WIP payments into weekly amounts when you enter this information into your settings.
Weekly expenses
This metric shows the actual weekly expenses incurred by your practice. Expenses will include all your costs associated with running a practice, such as wages, building and rent, supplies and marketing costs etc. This amount is based on the information entered in your settings. If you haven't entered this information, you can enter a value manually using the text box in this metric as below.

TOP TIP! Use the practice forecasting tool to see what billings your practice will need to generate to cover the extra expense of an admin or nurse team member. Adjust the weekly expenses to include the weekly cost of a new team member to then see what practice billings will be needed to break even and meet your billings target.
Billings needed to break even
This metric shows the total gross billings the practice needs to generate to break even based on the previous amounts entered for weekly income and expenses and based on the percentage of gross billings paid to the practice.
The practice share of billings is calculated from the service fee % entered in your Settings for each Practitioner. This then calculates the estimated weekly billings needed to ensure that the practice share of billings covers the difference between the weekly income and expenses of the practice.

TOP TIP! You can use the filters to adjust the historical calculations shown on the page using the Historical data filter to choose from Last week up to Last 52 weeks.
You can also choose your Prediction period (weeks) to select how far in the future you want to forecast your Billings needed to break even.
Last Week means the previous full Monday to Sunday time period and Next Week means the next full Monday to Sunday time period.
Billings target
Based on the information entered in Settings is what the billings target your practice would like to meet on a weekly basis. If you haven't entered this information into Settings or if you'd like to adjust your billings target, you can input a value manually using the text box.

TOP TIP! Understanding what your budget needs to be can be tricky. In this section, it's a good idea to think about your break-even point. Does it outweigh your target? Perhaps you need to increase your targets to ensure it covers your break-even point, with the goal of becoming profitable. This will help you understand what your goals are - what do you need to do to achieve this? Use this in tandem with our other metrics - how does your Future Utilisation look? Perhaps you can ensure you are fully utilised by using our Item optimisation metrics?
Appts per hour to break even next week
This metric shows the number of appointments per hour that are needed to generate the estimated billings required to make sure that the practice share of billings covers the difference between the weekly income and weekly expenses of the practice.
This is assuming that your doctors will work the same number of hours that are currently scheduled for and will, on average, bill the same per appointment as they have done over the past 4 weeks. This is calculated on the entered target figure.
Also shown is the historical average number of appointments your Practitioners completed.
Appts per hour to break even next week
Use this metric to see how many appointments per hour you need to break even next week. This metric looks at what is required in terms of patient numbers per hour, to make sure that the practice share of billings covers the difference between the weekly income and expenses of the practice.
Consider, that this metric is also assuming that your doctors will:
- work the same number of hours that are currently scheduled for, and
- on average, bill the same per appointment as they have done over the past 4 weeks.

Also shown underneath, the number of appointments needed to meet your Billing target. If you manually adjust the Billing target metric, this number will re-calculate.
TOP TIP! The last line on this metric shows you how many appointments per hour your doctors have completed, historically. This may vary, depending on the Historical data you are choosing to look at, in the filters. If you want to get a good average, select a longer time period - e.g. do not look at this in January if you experienced closures over Christmas, or just after flu season.
Appts per hour forecasting
This metric shows the current average appointments per hour, the appointments needed per hour to meet your target, and the appointments per hour needed to break even for the next week, two weeks, and three weeks.
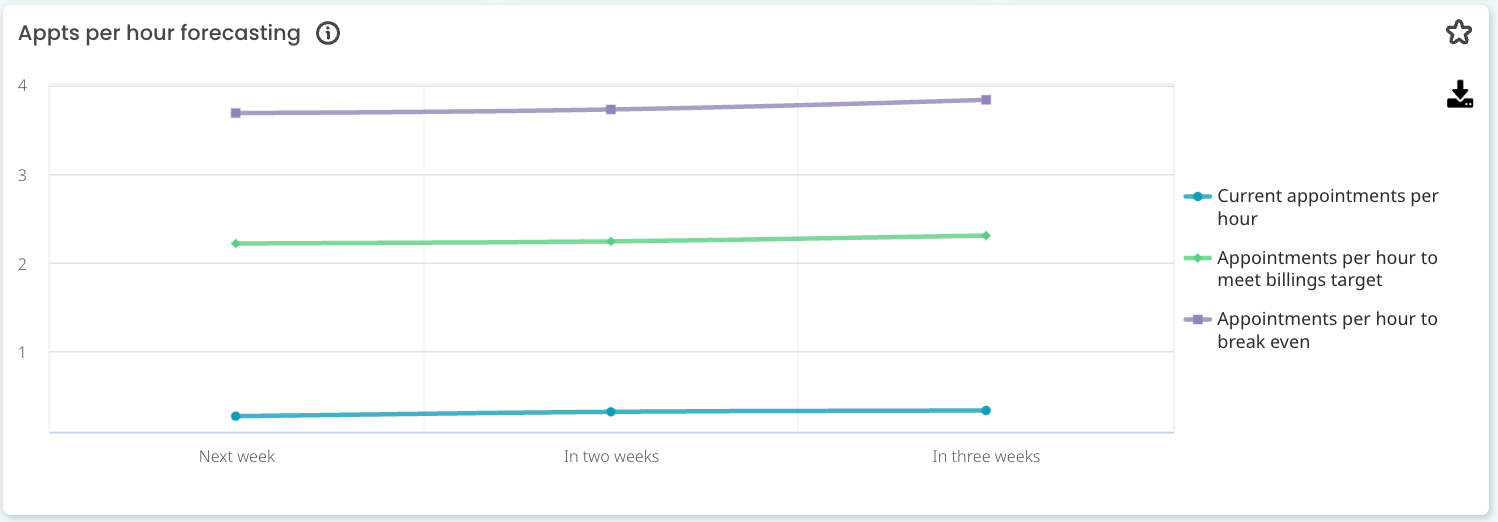
This is assuming that your doctors will work the same number of hours that are currently scheduled for and will, on average, bill the same per appointment as they have done over the past 4 weeks.
This is calculated on the entered billings target figure, as above.
Session hours to break even next week
This metric shows the number of session hours that would be needed to generate the estimated billings that are needed to make sure that the practice share of billings covers the difference between the weekly income and expenses of the practice.
This is assuming that your doctors will see the same number of patients per hour and on average, bill the same per appointment as they have done over the past 4 weeks.
This is also calculated for the billings target entered. Also shown is how many session hours are open for your doctors currently - so you know if you need more session hours or not.

TOP TIP! This metric can help you understand if you have enough Practitioners hours to meet your billings target. For some practical knowledge about how to manage this, check out our 5-minute power tips.
Session hours forecasting
This line graph shows the number of session hours that would be needed to generate the approximate billings needed to make sure that the practice share of billings covers the difference between the weekly income and expenses of the practice for the next 3 weeks.
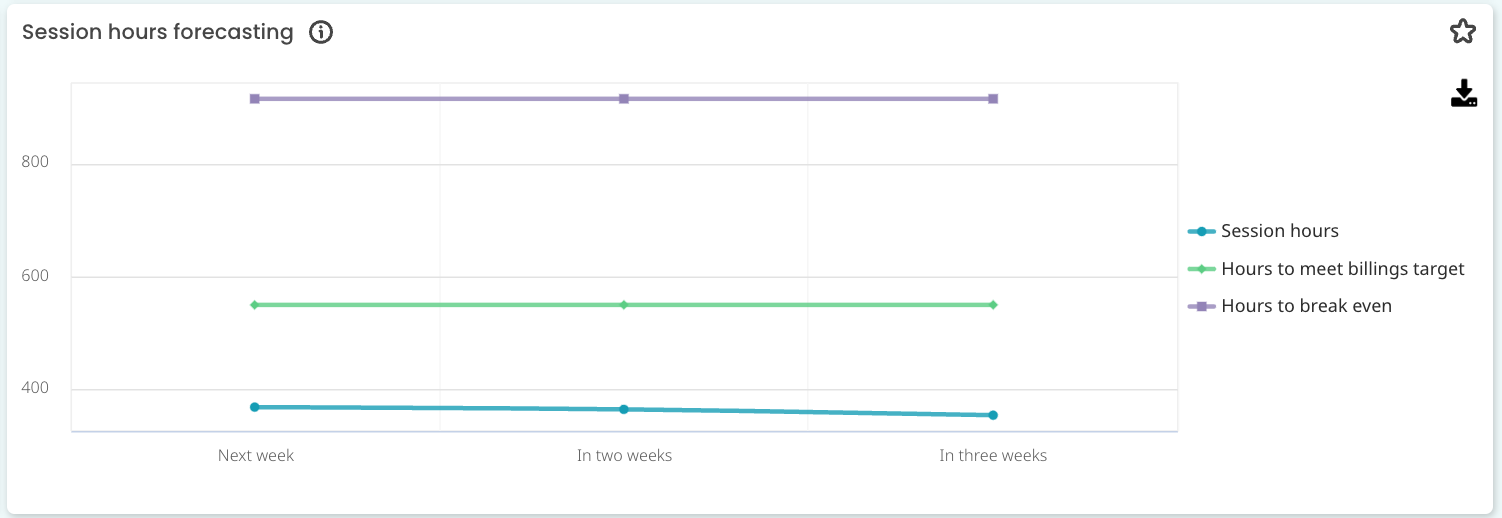
If your hours needed to break even are much higher than your anticipated session hours, you will need to consider some of the following strategies:
- Look at reducing expenses - is there anything that you can do, to reduce costs across your Practice, in light of the limited session hours expected?
- Understand your short-falls - have you looked at what the average billings per hour is, against your cohort, using our Touchstone cabinet?
- Increase CDM management - are your Practitioners happy with their CDM management, or could your team be doing more to support this?
- Decrease activities that reduce billings - are your DNA rates high? Or do you need to look into the amount of admin time that is being spent on long-winded processes - e.g. not using electronic referrals.
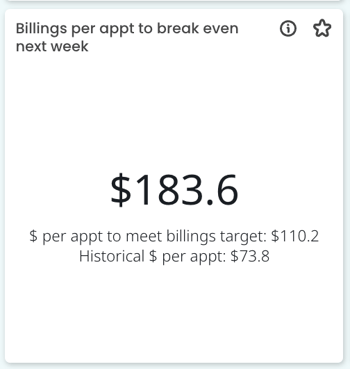
Billings per appt to break even next week
Based on the current number of appointments booked for the next week, how much, on average, would need to be billed per appointment to break even?
To break even would be to bill enough to make sure that the practice share of billings covers the difference between the weekly income and expenses of the practice.
TOP TIP! We have some wonderful resources created by our Customer Success Team who are all previous Practice Managers. Please check out some of our ideas about what to look at in Cubiko for Practice Owners and Managers
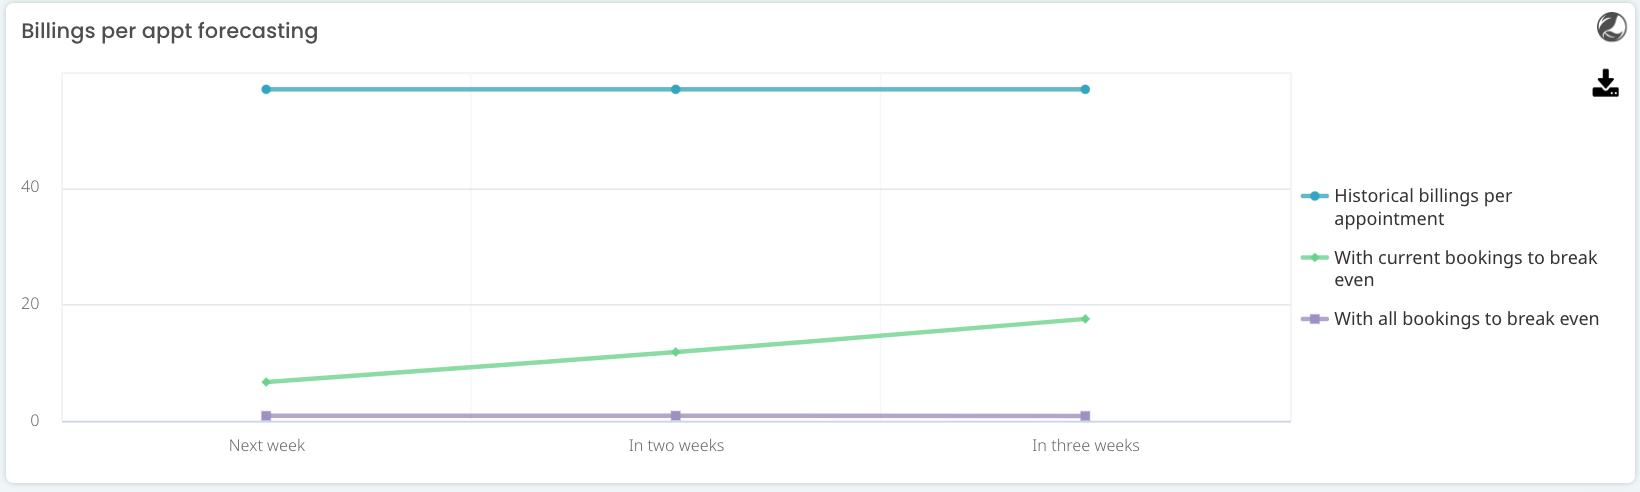
Billings per appt forecasting
Review the line chart to see the data from the Billings per appointment to break even next week metric, over the next three weeks.