
Have you always wanted to know how much time in your day was booked, seeing patients, or performing admin tasks? This metric will allow you to see a breakdown of the total Session hours, Booked hours, Consulting hours and Days away in the practice, as well as a breakdown by Practitioner and the trend over time.
To navigate to this metric, go to Clinic Insights > Past Clinic Metrics > Utilisation & hours tab > Consulting hours

This figure represents the practice total hours spent consulting for the period selected. Consulting hours include all the patient appointment timeslots that are completed, billed, paid and booked (excludes DNA & double-booked appointments). Click through to see other time breakdown calculations.
The sections included in this article relating to Practitioner hours are:
- Session hours
- Booked hours
- Consulting hours
- Hours by practitioner
- Days away by Practitioner
- Total Practitioner hours
Session hours
This figure represents the practice's total session hours for the time period selected. Session hour includes the time opened up in your appointment book (either via the sessions setup or right-click make available). It excludes practice closures, days away and right-click make unavailable.

Use the Select role filter to refine this figure down to only your doctors, nurses, allied health or specialists in your practice as applicable.

TOP TIP! Click through on the metric heading to go to our Hours page.
The Hour's page gives you a detailed breakdown of all of your hours in the clinic and how they are used to calculate your booking and consulting utilisation- Visit our knowledge base on the Hour's page here!
Booked hours
This figure represents the practice total booked appointment time for the time period selected. Booked hours include all appointments that are completed, billed, paid, DNA, booked & double booked.

TOP TIP! Booked hours can often be more than your Session hours, due to counting every appointment time length booked. If you have double or triple bookings, this will then show if you have 'overbooked' your Session time, as it will be greater in number.
Consulting hours
This figure represents the practice total consulting hours for the period selected. Consulting hours include all the patient appointments that are completed, billed, paid and booked and excludes DNA appointments, non-patient appointments (such as Meeting or Other) & double-booked appointments.

TOP TIP! We have different variations on how we define the time spent by your Practitioners within Cubiko. Understanding these definitions will help you use the best time measurement for your practice. CLICK HERE to see the definitions and a short video explaining time definitions.
NOTE: An appointment's status will impact how the hours are calculated, so it is important to ensure your appointment books are correctly finalised before reviewing these reports. See Uncompleted Patient Appointments.
Status types that will not show as booked or consulting time until completed include: "Waiting", "With dr" or "at billing"
Hours by practitioner
This figure represents the practice total hours filtered by Practitioner for the time period chosen.
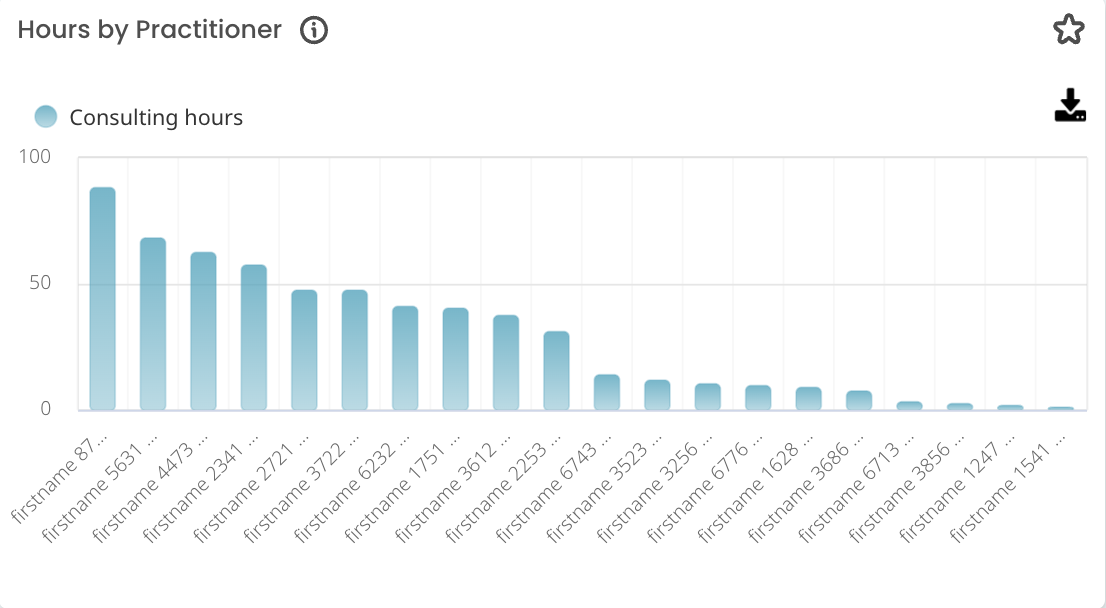
TOP TIP! Use the filters on this page to select your hour type. This will apply to all graphs on the page!

You can change this graph to see where your practitioners sit for booked hours, consulting hours and session hours!
Perhaps one of your practitioners has the highest booked hours but has low consulting hours due to having a high number of DNA appointments! Use our DNA metric to review this in more detail.
Days away by Practitioner
This figure represents the days away (from the sessions setup screen) and right click - make unavailable filtered by Practitioner for the time filter chosen.

Right-click unavailable time is calculated as the number of days the practitioner has been marked unavailable (based on a standard working day of 7.6 hours).
NOTE: If you need to extend existing leave dates for a Practitioner in your Practice Management Software (PMS), but the leave dates have already begun, ensure you add an additional 'Away' session, rather than editing the one already occurring. Editing an existing in-play 'Away' session can cause the start date of that session to reset to the current date and will affect the Days away calculation in the Cubiko metric.
TOP TIP! Does one of your practitioners seem to have lower than usual session hours than usual? See here if they have had days away!
Total practitioner hours
This figure shows the average total (selected) hours over the time frame selected and the Practitioner filter chosen.
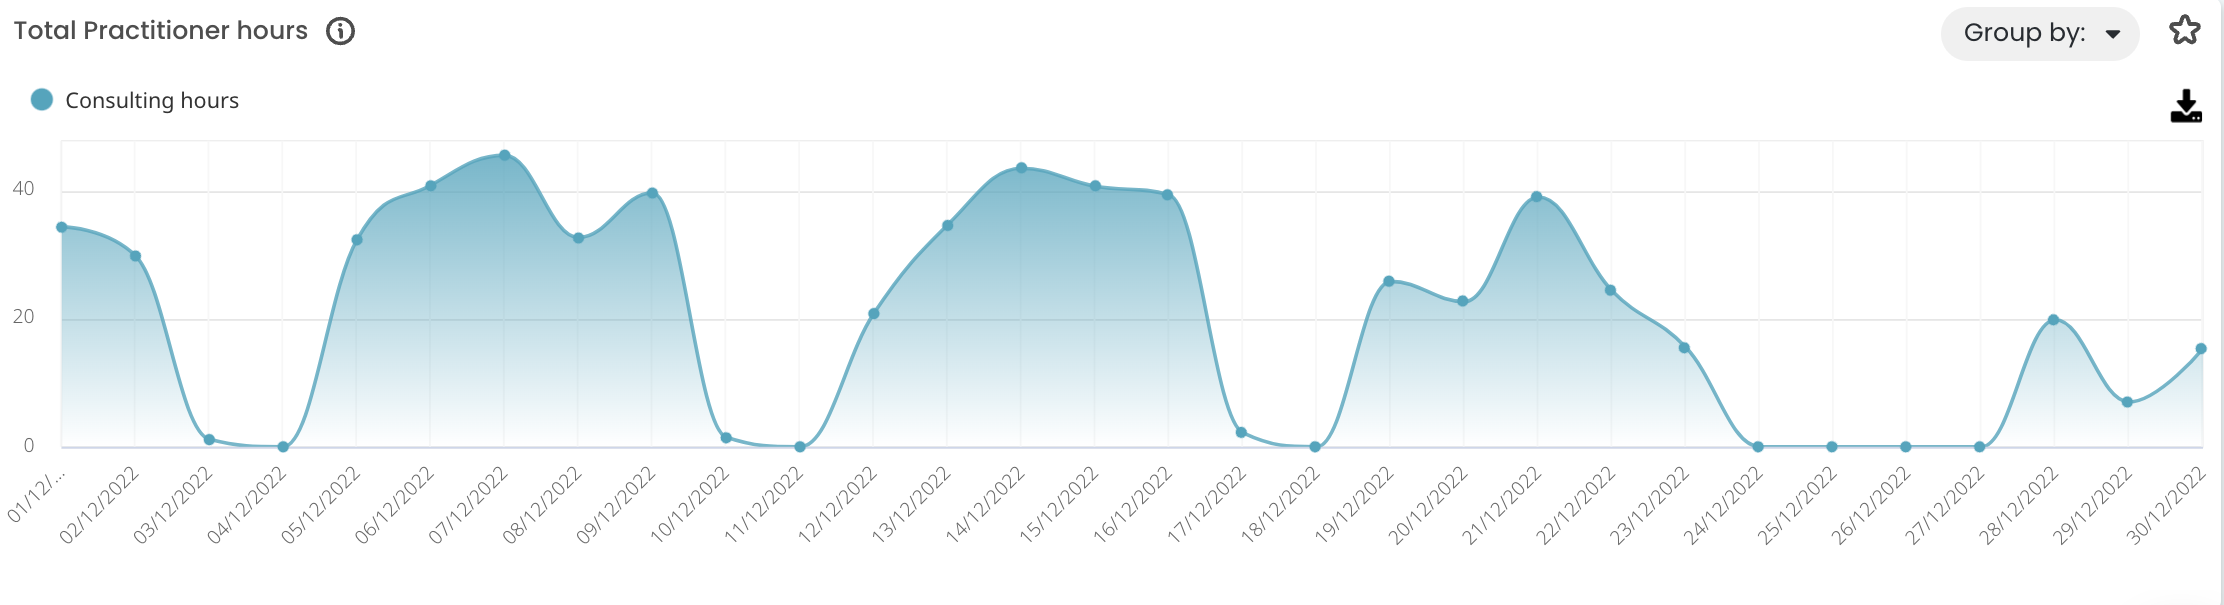
TOP TIP! Remember to use the filters on this page to select your hour type. You can track the trend for each hour type in your practice over the selected time frame!