
To navigate to this metric, go to Clinic Insights > Past clinic metrics > Utilisation & hours tab > Clinic Consulting utilisation

The front tile shows the proportion of available time that has been spent consulting with patients. This figure is calculated by dividing the duration of all patient appointments (booked, completed, billed, and paid appointments) by the total available session hours for team members.
Click through to see more information around Booked utilisation, Unbooked & Non-patient time.

1. Clinic booking utilisation: this is the proportion of available time that has been booked with patient appointments. Higher numbers indicate that your team is more heavily booked. Utilisation is calculated by dividing the duration of all booked patient appointments (completed, billed, paid, booked, double-booked, DNA) by the total available session hours for team members.
2. Clinic consulting utilisation: this is the proportion of available time that has been spent consulting with patients. Higher numbers indicate that your team is more heavily utilised. Utilisation is calculated by dividing the duration of all patient appointments (booked, completed, billed, and paid appointments) by the total available session hours for team members.
TOP TIP! Use the Utilisation type filter on this page to change your view in the metrics below by either Booking or Consulting utilisation calculations.

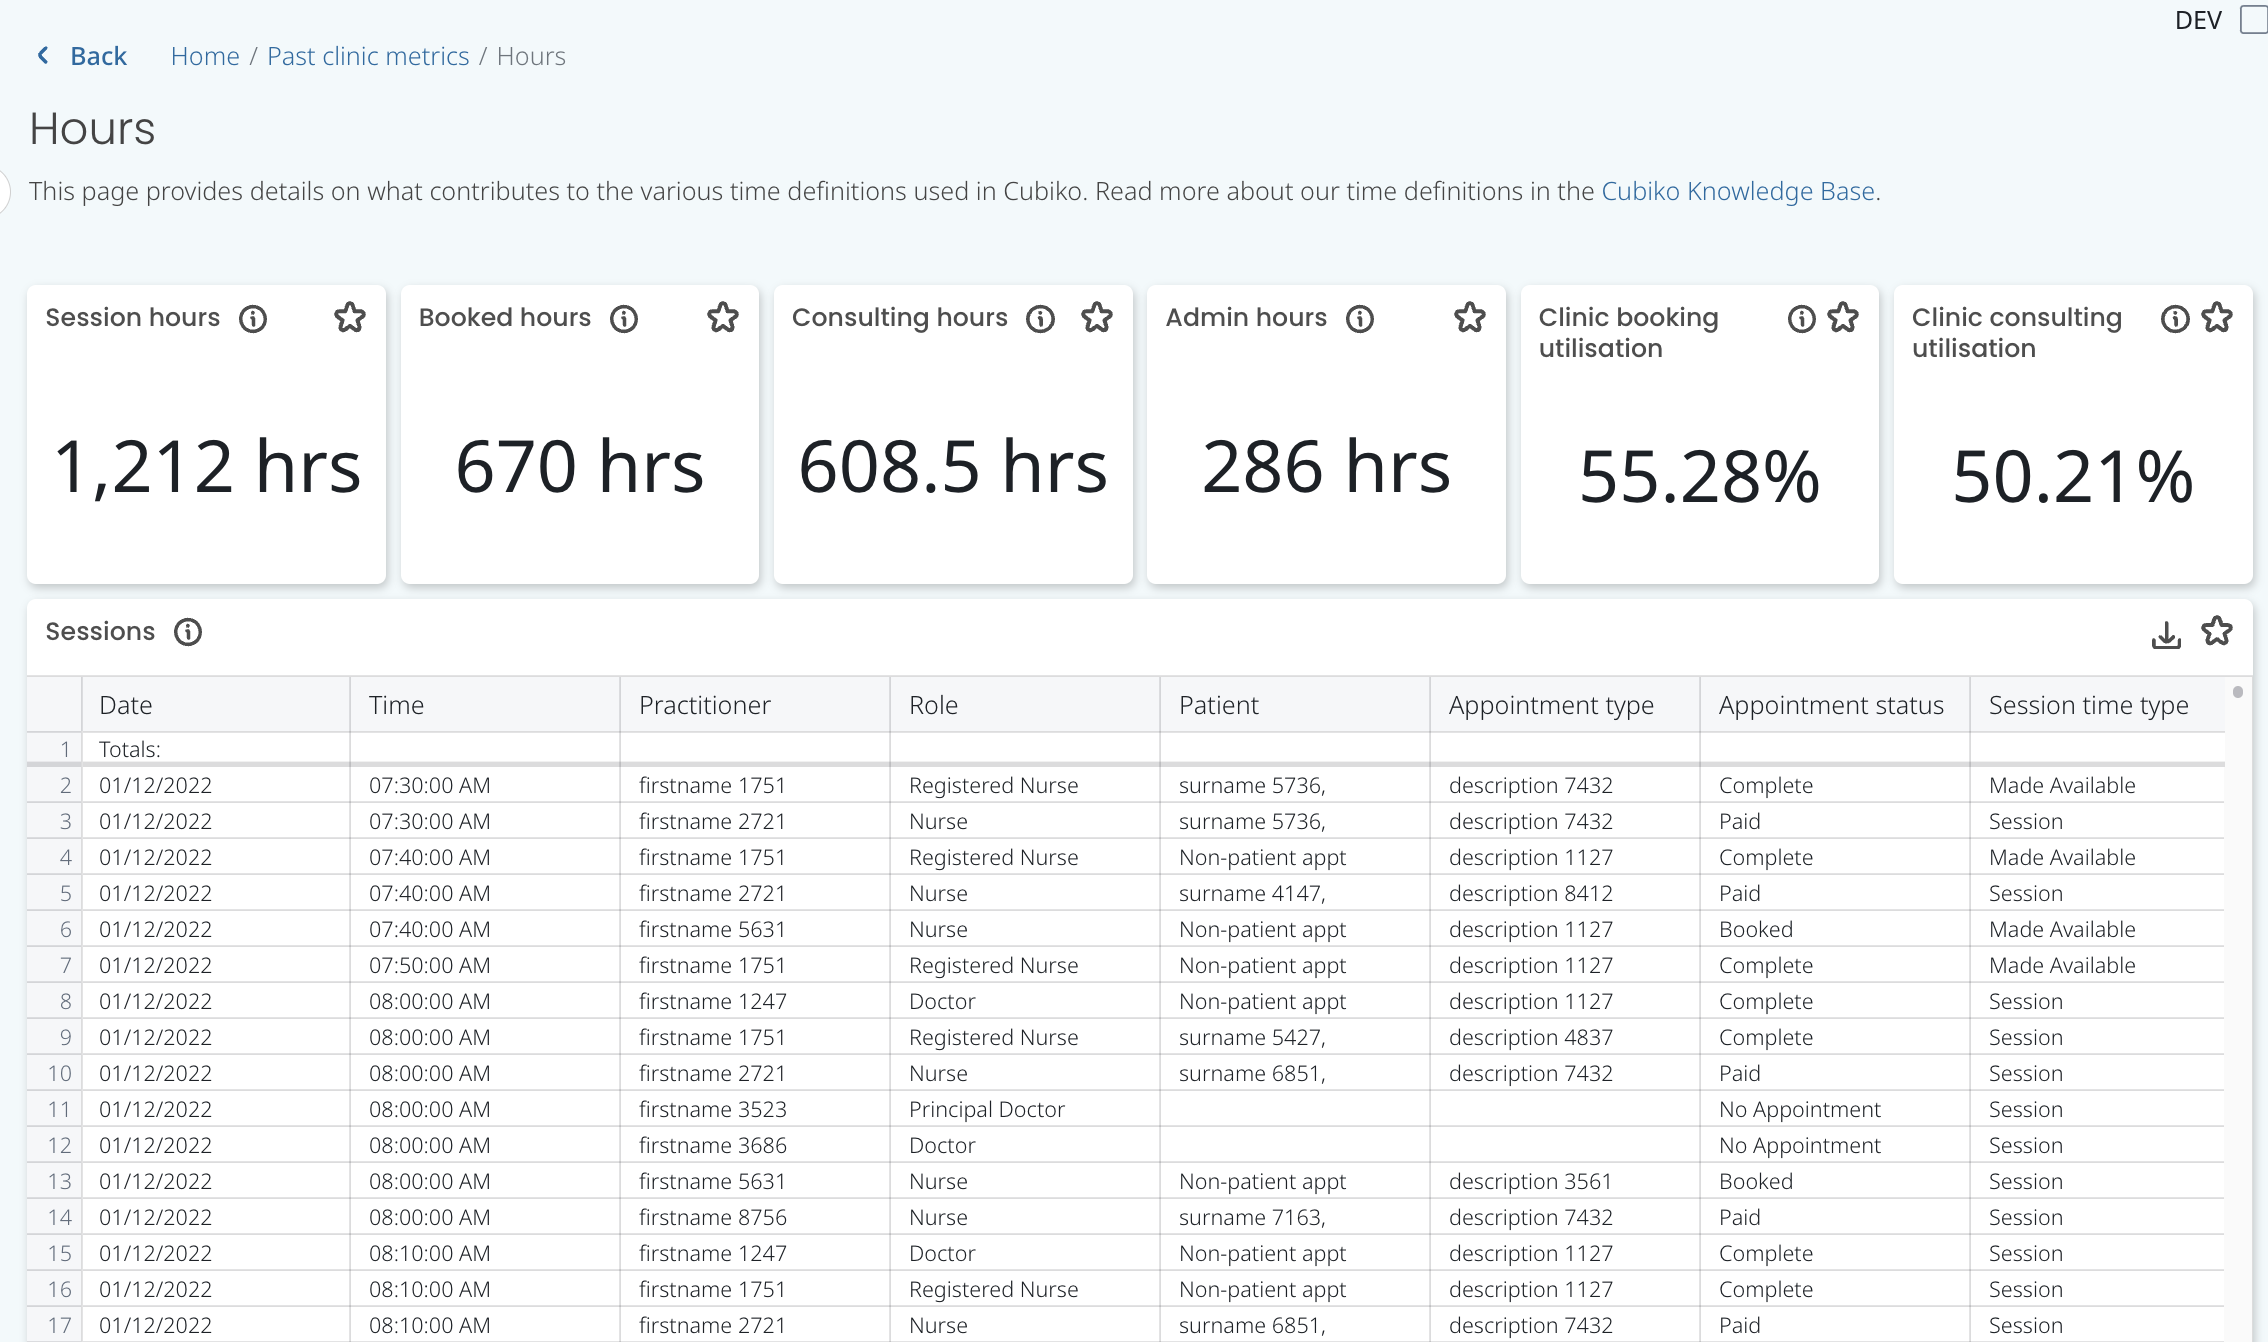
NOTE: Clicking through on the headings Clinic booking utilisation or Clinic consulting utilisation on either tile will take you through to our Hours page.
The Hours page gives you a detailed breakdown of all of your timeslots in your appointment book and how they they have been used to calculate your booking and consulting utilisation. For more information visit our knowledge base on the Hours page here!
The sections included in this article relating to Clinic consulting utilisation are:
- Utilisation by role
- Utilisation by practitioner
- Non-Patient-facing hours by Practitioner
- Unbooked time (hours) by Practitioner
- Trend of clinic utilisation
- Hours breakdown
Utilisation by role
This graph shows either the booking utilisation or consulting utilisation figure (select in the drop-down filter) grouped by role. Higher numbers indicate that your team is more heavily booked. Some roles like nursing may complete non-patient-consulting work so will ordinarily have more unbooked time to ensure practice support tasks are completed.

Top Tip: When setting Utilisation targets in Settings > Targets, ensure to have a realistic goal for the expected consulting utilisation.
A 100% Utillisation target means a user is expected to be booked (and consult) with patient-facing appointments for the entire time they are available.
If you have a role that is required to perform non-patient-facing tasks, such as sterilising, recalls and reminders, or other administration tasks, you may choose to review the time split among administration and patient-facing time.
Utilisation by Practitioner
This graph shows either the booking utilisation or consulting utilisation (select in the drop-down filter) for each team member. Higher numbers indicate that the team member is more heavily booked.

TOP TIP! You can use the information you gather here to understand if Practitioners are utilising their time effectively whilst in the Practice and also in comparison to your targets.
Targets can be set on an individual user basis in our Cubiko Settings > Advanced Settings > User Targets page.
Non-patient facing hours by Practitioner
This figure shows the total non-patient-facing hours for each team member. Non-patient-facing time is where the appointment book has either been made unavailable or a non-patient appointment type has been booked (e.g. Other, Admin, Meeting).

Click through on the metric heading on tile to see a total of non-patient facing hours in the practice and a detailed list of all non-patient facing appointments (all of the appointments where the diary has been made unavailable or a non-patient appointment type has been booked e.g. Other, Admin, Meeting.

TOP TIP! Non-patient appointment types can be set up in your Cubiko Settings.
Go to Settings > Appointments and untick 'Is this a patient appointment?' to count the appointment type as non-patient or admin time.

Unbooked time (hours) by Practitioner
This figure shows the sum of unbooked time for each team member that was available to be booked (appointment book open but not booked).
This is great for tracking if your practitioners need more patients booked into their day.

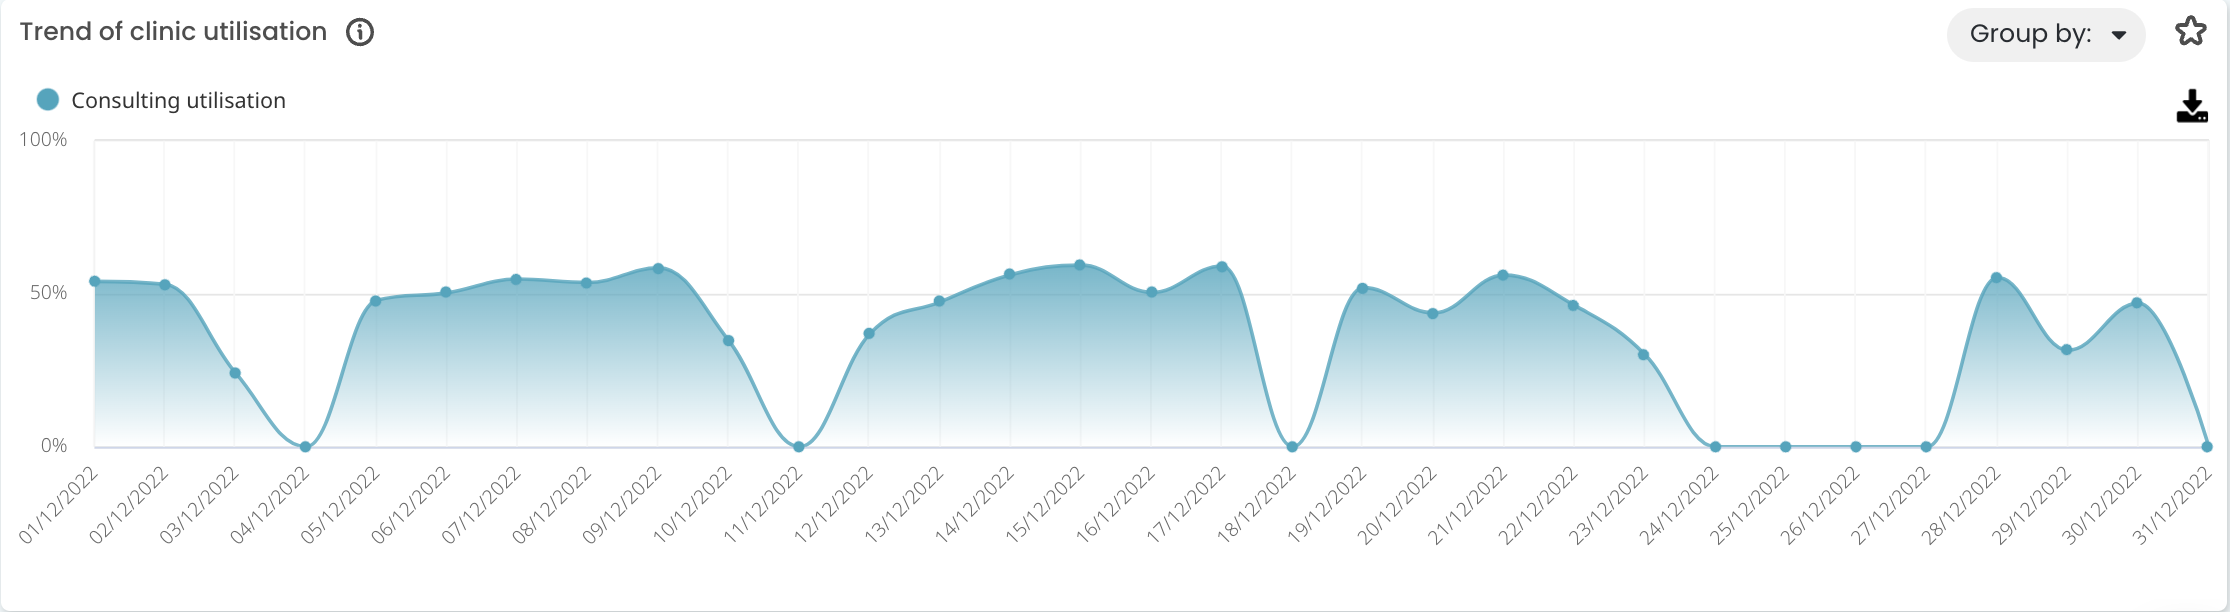
Trend of clinic utilisation
This graph shows either the booking utilisation or consulting utilisation (select in the drop-down filter) and how this trend has changed over time. Higher numbers indicate that your team is more heavily booked.
Hours breakdown
Clicking through on the headings Clinic booking utilisation or Clinic consulting utilisation on either tile will take you through to our Hours page.
The Hours page gives you a detailed breakdown of all of your timeslots in your appointment book and how they they have been used to calculate your booking and consulting utilisation.
For more information visit our knowledge base on the Hours page here!
TOP TIP! We have variations on how we define the time spent by your Practitioners within Cubiko. Understanding these definitions will help you use the best time measurement for your practice CLICK HERE to see the definitions and a short video explaining time definitions.