
In General Practice, we have two levers to increase profitability. Increase revenue or decrease expenditure. Cubiko has metrics that help you do both.
To navigate to the Xero Cabinet, go to Integrations > Xero

The sections in this article about the insights in the Xero cabinet are:
- Watch our Coffee & Cake with Cubiko webinar on our Xero metrics
- Net profit this financial year
- Expenses per appointment
- Revenue per appointment
- Leave balances
- Aged payables
- Aged receivables
Watch our Coffee & Cake with Cubiko webinar on Xero
Watch Chris and Christina discuss how you can use Xero data, your accounting expenses and more in our Coffee & Cake with Cubiko webinar.
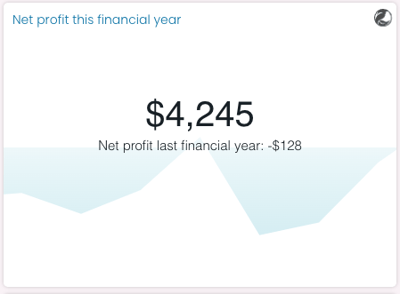
Net profit this financial year
Gaining valuable insight into your net profit is important when it comes to understanding and determining your practice’s financial health. Generally, your accountant will prepare detailed financial statements which outline your profit and loss for the current financial year.
This metric represents the net profit for this financial year (starting 1st July).
Click through on the heading to see a more detailed page of trends and a monthly breakdown of net profit.
Net Profit (rolling 12 months)
Cubiko’s rolling net profit metric showcases your monthly financial trends. This helps you to visualise what’s happening financially in your practice and ensure that you’re on track to meeting your practice’s financial goals.

TOP TIP! Use the download button on the metric to export a .CSV file to see month-to-month numerical data in a table format.

Net Profit (cumulative 12 months)
This figure shows the cumulative net profit for the last 12 months. If a month had a net loss it would cause the trend line to decrease and if there was a net profit the trend line will increase.

Revenue vs. Expenses this financial year
This figure breaks down how net profit has been calculated for this financial year.

NOTE: This metric does not include any revenue or expenses incurred in the current month.
Net profit last financial year
This figure shows the total net profit for the last financial year.
Financial years are calculated starting 1st July and ending 30th June.

Net profit this financial year
This figure shows the total net profit for the current financial year. This will not include the current month.
NOTE: This metric does not include any data for the current month.
Expenses per appointment
This figure takes the total expenses for last month and finds the average expense per appointment.
Click through to see more insights, including Expenses per GP Consulting hour, per New Patient, Expenses as a % of total billings, and to see a breakdown by expense accounts and how this number has changed over the past 12 months.

It can be challenging to put together an action plan that helps increase the profitability of your practice. A good starting point is having a clear understanding of the costs associated with appointments in your practice. Do you have a high consumable cost per appointment? If so, look at where you can potentially decrease your consumable cost, or increase the number of appointments in that period per consumable.
NOTE: Clicking on the heading in this metric will take you to Appointment Count in Past Clinic Metrics
TOP TIP: Use the filters on the more detailed page to view different months (Select Period)

Or to look at specific expenses (Select Cost Account)

Expenses by account
This figure shows a breakdown of the selected month's expenses by account name.

TOP TIP! Use this metric to see your largest expenses per appointment and the impact of reducing or removing that expense.
Expenses per appointment
This figure takes the total expenses for the selected month and finds the average expense per appointment.
TOP TIP! Use this metric to select certain cost accounts, such as your consumables to review your average consumables cost per appointment.
NOTE: Clicking on the heading in this metric will take you to Appointment Count in Past Clinic Metrics
Expenses per GP consulting hour
This figure takes the total expenses for last month and finds the average expense per GP consulting hour.
This is an excellent metric to share with your practitioners as it provides insight into the support services you provide per doctor consulting hour.

NOTE: Clicking on the heading in this metric will take you to Practitioner Hours in Past Clinic Metrics. Wondering what is considered a 'Consulting Hour'? You can learn more about Cubiko time definitions here.
Selected expense accounts as a % of total billings
This figure shows how much of your total billings are spent on the selected expense accounts for the selected month.

TOP TIP! Want to know what % wage costs make up of your total billings? Use the Select Cost Account filter to choose your cost accounts for wages to see specifically what % of your total billings different expenses account for.
Expenses per new patient
This figure takes the total expenses for the selected month and finds the average expense per new patient.

TOP TIP! By using the Select Cost Account filter and selecting your cost accounts for marketing, you can see how much you are spending on advertising for every new patient.
NOTE: Clicking on the tile of this metric will take you to the New Patients metric in Past Clinic Metrics.
Trend of expenses per appointment and per GP consulting hour
This figure shows how your average expenses per appointment and expenses per GP consulting hour have changed over the past 12 months.

Trend of expenses as a % of total billings
This figure shows how your expenses as a % of total billings have changed over the past 12 months.

TOP TIP! Use this trend graph to see if any strategies you have implemented to reduce expenses have had an impact.
Trend of expenses per new patient
This figure shows how your average expenses per new patient have changed over the past 12 months.

TOP TIP! Use this metric to see the impact of different marketing strategies used to gain new patients over time.
Revenue per appointment
This figure takes the total revenue for last month and finds the average revenue per appointment.
Click through to see a more detailed page to view this metric broken down by revenue accounts and how this number has changed over the past 12 months.

The information learned helps you to determine if your practice is breaking even or if you need to increase appointment numbers to ensure profitability.
This metric is also useful to compare the costs of running an appointment versus the revenue you’ve earnt from that appointment. This is important to ensure that your practice continues to be financially stable.
Revenue by account
This figure shows a breakdown of the selected month's revenue by account name.

Revenue per appointment
This figure takes the total revenue for the selected month and finds the average revenue per appointment.

NOTE: Clicking on the heading in this metric will take you to Appointment Count in Past Clinic Metrics.
Revenue per GP consulting hour
This figure takes the total revenue for last month and finds the average revenue per GP consulting hour.
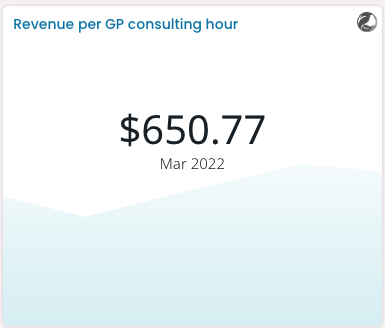
NOTE: Clicking on the heading in this metric will take you to Practitioner Hours in Past Clinic Metrics. Wondering what is considered a 'Consulting Hour'? You can learn more about Cubiko time definitions here.
Selected revenue accounts as a % of total billings
This figure shows how much of your total billings are attributed to the selected revenue accounts for the selected month.

Revenue per new patient
This figure takes the total revenue for the selected month and finds the average revenue per new patient.

NOTE: Clicking on the tile of this metric will take you to the New Patients metric in Past Clinic Metrics.
Trend of revenue per appointment and GP consulting hour
This figure shows how your average revenue per appointment and revenue per GP consulting hour have changed over the past 12 months.

Trend of revenue as a % of total billings
This figure shows how your revenue as a % of total billings has changed over the past 12 months.

Trend of revenue per new patient
This figure shows how your average revenue per new patient has changed over the past 12 months.

Leave balance
This figure represents the total leave balance across all Xero employees.
Click through on this metric to see a more detailed page of this broken down by leave type, employment basis and employee.

Cubiko pulls through data that allows you to view and assess the current leave liability within your practice. This data and insight can be incredibly handy when talking to staff about any upcoming leave.
TOP TIP! Roster staff for busy periods within the practice such as flu vaccination season, and try to coordinate leave where appropriate for quieter periods or when your contractors are away.
Leave balances by leave type
This figure shows a breakdown of how much leave is owed for each leave type.

TOP TIP! Use the download button on the metric to download the data as a .CSV file to get a quick numerical overview of your different leave-type liabilities.
Leave balances by employment basis
This figure shows a breakdown of the net leave balance for each employee by employment basis. (e.g. casual, part time and full time).

Leave balance by employee
This figure shows a breakdown of how much leave is owed and due for each employee and which leave type.

TOP TIP! Review this graph to ensure staff are not accruing excess leave.
Have key team members taken a holiday? Is there a risk of someone taking extended leave? Do you need to plan backfill?
Have team members been taking leave they are not entitled to? Are their leave balances in arrears? If so, what action plans to you have in place to ensure they return to correct levels?
Make sure you are complying with the relevant employment legislation and awards with regards to advising staff to take leave.
Aged payables
This figure represents the total amount due to be paid. Click on the heading to see further details on when these invoices are due and a breakdown by contact.

Payables by contact
This figure shows a breakdown of the total amount payable by each contact.

TOP TIP! Use this graph to review which contacts you are spending the highest $ value with.
Payables by age
This figure shows how many invoices are overdue and how many are due in the coming weeks.

TOP TIP! Review this graph to check how many invoices are overdue and how many are coming up! You can then use the Aged payables table to follow up with payments and prepare your cash flow.
Aged payables
This table lists the details for each payable invoice, this includes the contact, invoice number and amount due.

TOP TIP! Use the drop-down option on the table columns to sort in ascending or descending order to group specific contacts' invoices together.
Aged receivables
This metric allows you to see at a glance any outstanding invoice that is due to be received.
Click through for a more detailed page that shows further details on when these invoices are due while also providing a breakdown of each contact and their amount owing.

This data is material for cash flow. For example, you’re paying your rent next week. Have you received your rental payment from your subcontractors who rent a room from you at your practice? Cubiko allows you to easily identify whose rental payment is still outstanding and when it is due.
Receivables by contact
This figure shows a breakdown of the total amount of receivables for each contact.

Receivables by age
This figure shows how many invoices are overdue and how many are due in the coming weeks.

Aged receivables
This table lists the details for each receivable invoice, this includes the contact, invoice number and amount due.

TOP TIP! Use the drop-down option on the table columns to sort in ascending or descending order to group specific contacts' invoices together to make it easier to contact about all their outstanding invoices at the same time.