
This figure represents practice billings (inclusive of GST, and based on service created date) and how they compare to the same time last year. Click to see billings against target at a daily level, or by individual Practitioner. Billings will include those from inactive or deleted users.
To navigate to this metric, go to Clinic Insights > Past clinic metrics > Billings tab > Total Billings (By Service Created Date)

The sections included in this article are:
- Billings by Practitioner
- Total Billings
- Trend of billings vs. Target vs Same time last year
- Billings (by service date created) by MBS Item
- Average billings (by service created date) by weekday
- Billings (by service created date) Appointment Type
- Total billings by eligibility
- List of billings
Billings by Practitioner
This figure represents practice billings (inclusive of GST, and based on service created date) per Practitioner.
Billings will include those from inactive or deleted users so that you can understand where billings came from, from the same period last year. Last year's billings are indicated on the graph as red dots. Where Practitioners do not have a red dot, they were likely not billing for this time period last year.
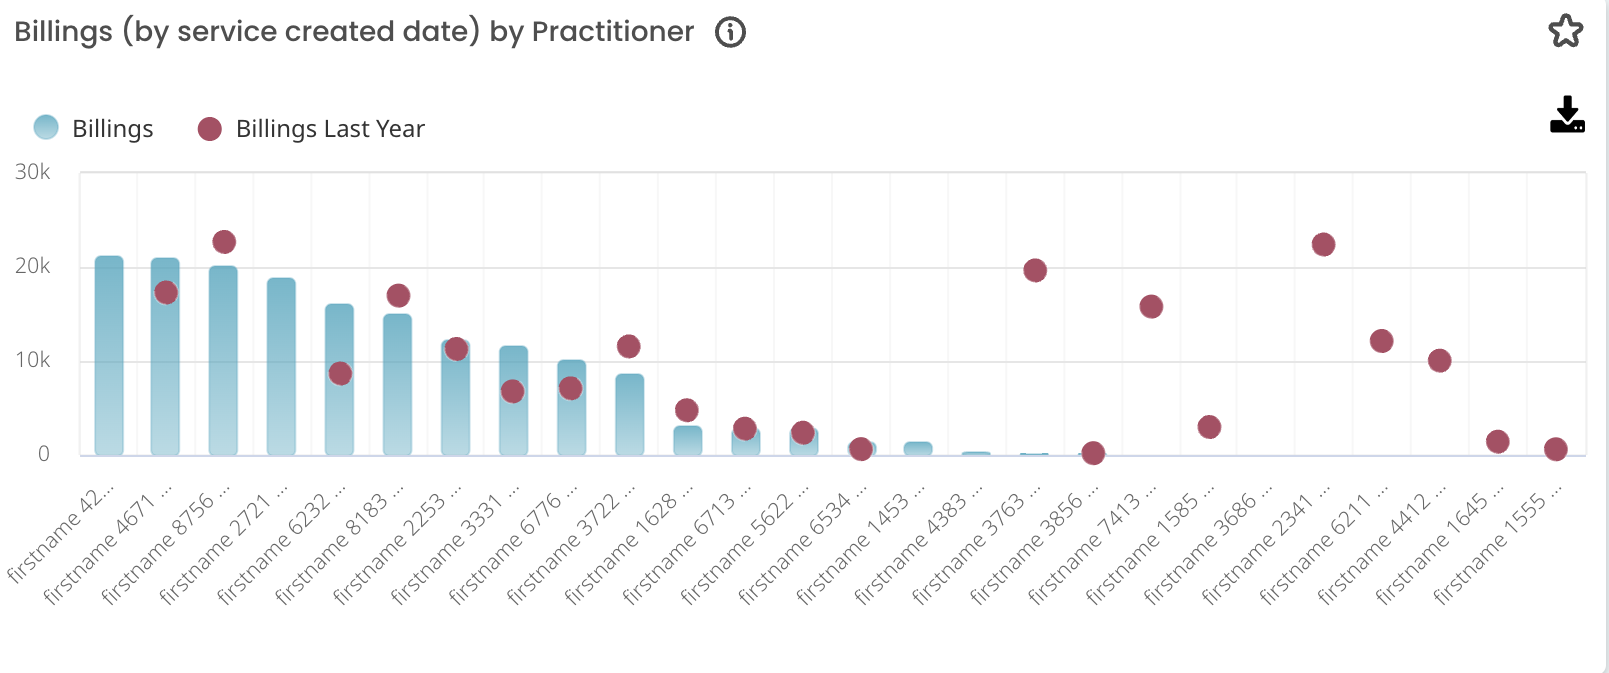
TOP TIP! Select a Practitioner on this graph to focus on their data showing in the remainder of the metrics on this page.
Total billings (by service created date)
This metric shows your Total Billings by service created date as per your selected time period. It also gives a breakdown of last year's billings, the value that your practice is currently up or down on in regards to these billings, and furthermore, by percentage.
It also gives you some insight into where your total billings (by service created date) sit in relation to the target set by your practice (currently worded as budget) for this period and how much it is up or down by, both value and percentage.

Trend of billings vs. Target vs Same time last year (by service created date)
The figure shows practice billings (inclusive of GST, and based on service created date) vs. target and vs. the same time last year over time.

As you can see above, the target set by the practice is shown, as is the previous year's billings for this period.
This graph allows you to track, by whichever date range you chose, how your billings are measuring against key performance indicators for your own clinic.
TOP TIP! If you are viewing data over a longer period of time (e.g. a year) then it is possible to use the 'group by' drop-down filter on the graph to view the data on a daily, weekly, or monthly basis to understand how your billings have changed over time.
Billings (by service created date) by MBS Item
Understand what MBS billings are being made and when, use the Billings By Practitioner metric to filter by Practitioner, so you can see which MBS items they are billing specifically.
Each MBS item billed by your practice is represented on this graph. If an MBS item has not been billed during the selected time frame then it will not appear on this graph.
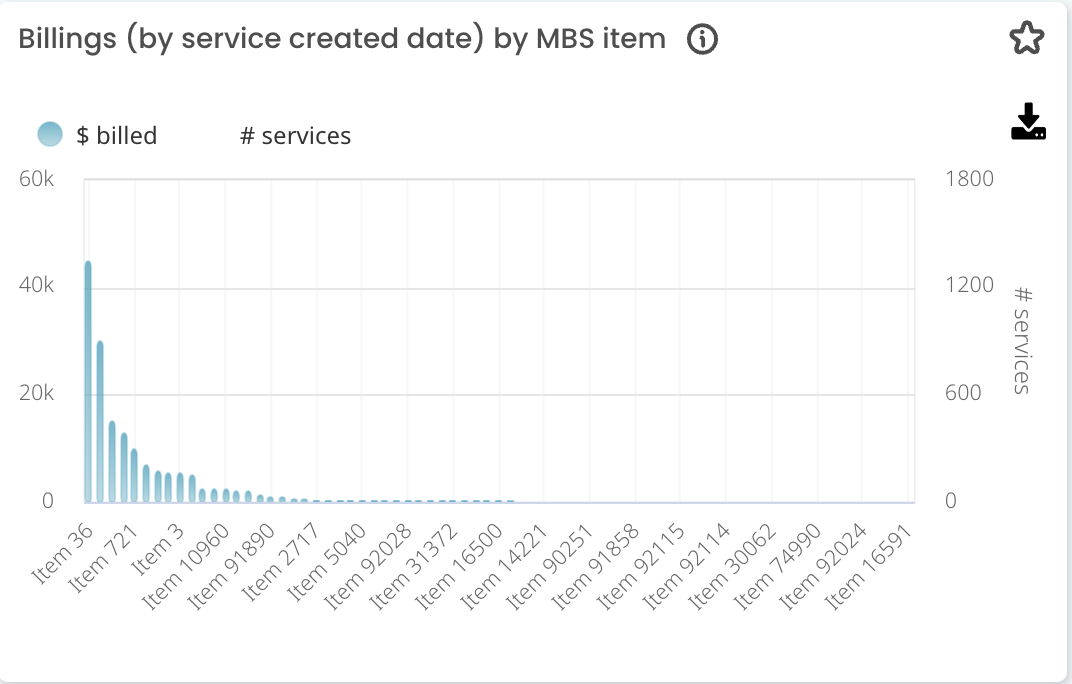
NOTE: This table will also include any custom item numbers you have created in your practice management software.
Average billings by weekday
This figure represents the average billings (inclusive of GST, and based on service created date) by the day of the week.

TOP TIP! Use your filters to the side to filter this table down for key information. As an example item number, you may wish to filter down via telehealth items and see on average which days you have the most telehealth items billed OR perhaps you have some days with high billings for Chronic disease management items on average compared to other days- does this fit with your nursing roster?
Billings (by service created date) by Appointment Type
This graph represents practice billings (inclusive of GST, and based on service created date) by appointment type. This will only include billings that are linked to an appointment in BP.
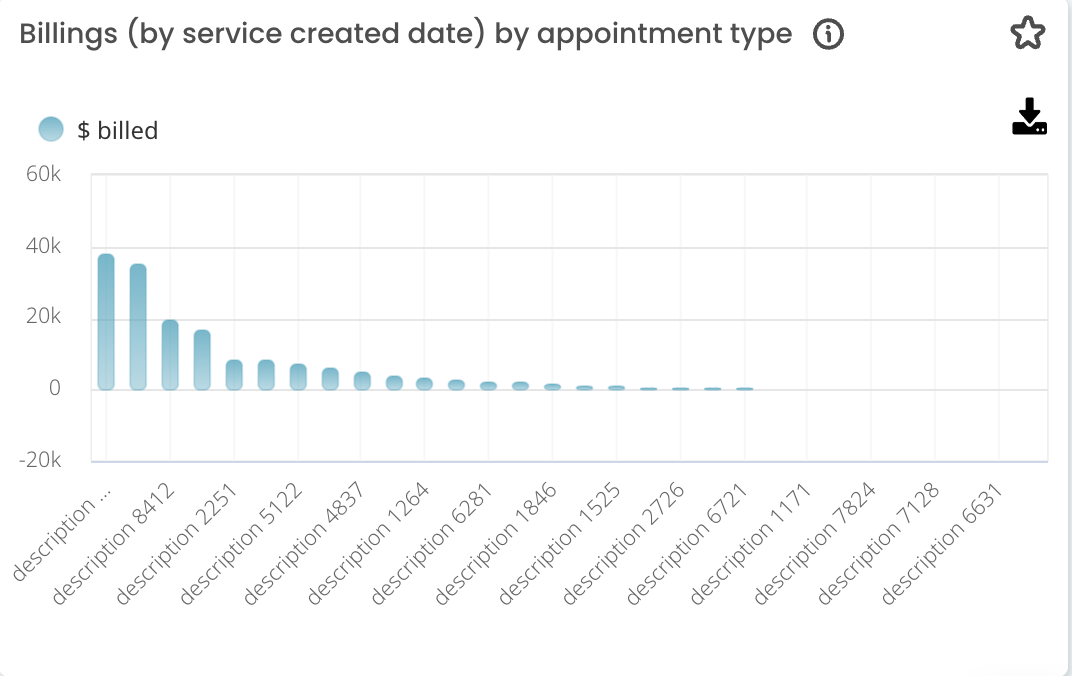
TOP TIP! Use both the Billings by Item and the Billings by Appointment Type to understand what practitioners are billing when they use a certain appointment type - for example, are items that typically take more time being billed alongside standard appointment types?
Total billings by eligibility
This chart represents the percentage of total billings attributed to each bulk billing eligibility category.

TOP TIP! Hover over the chart to get a detailed breakdown of each eligibility:
You can also use the filter eligibility type in your sidebar to filter your whole page and list of billings below via eligibility type.

List of billings
This table lists the billings (inclusive of GST, and based on service created date) for services that were rendered in the selected period.
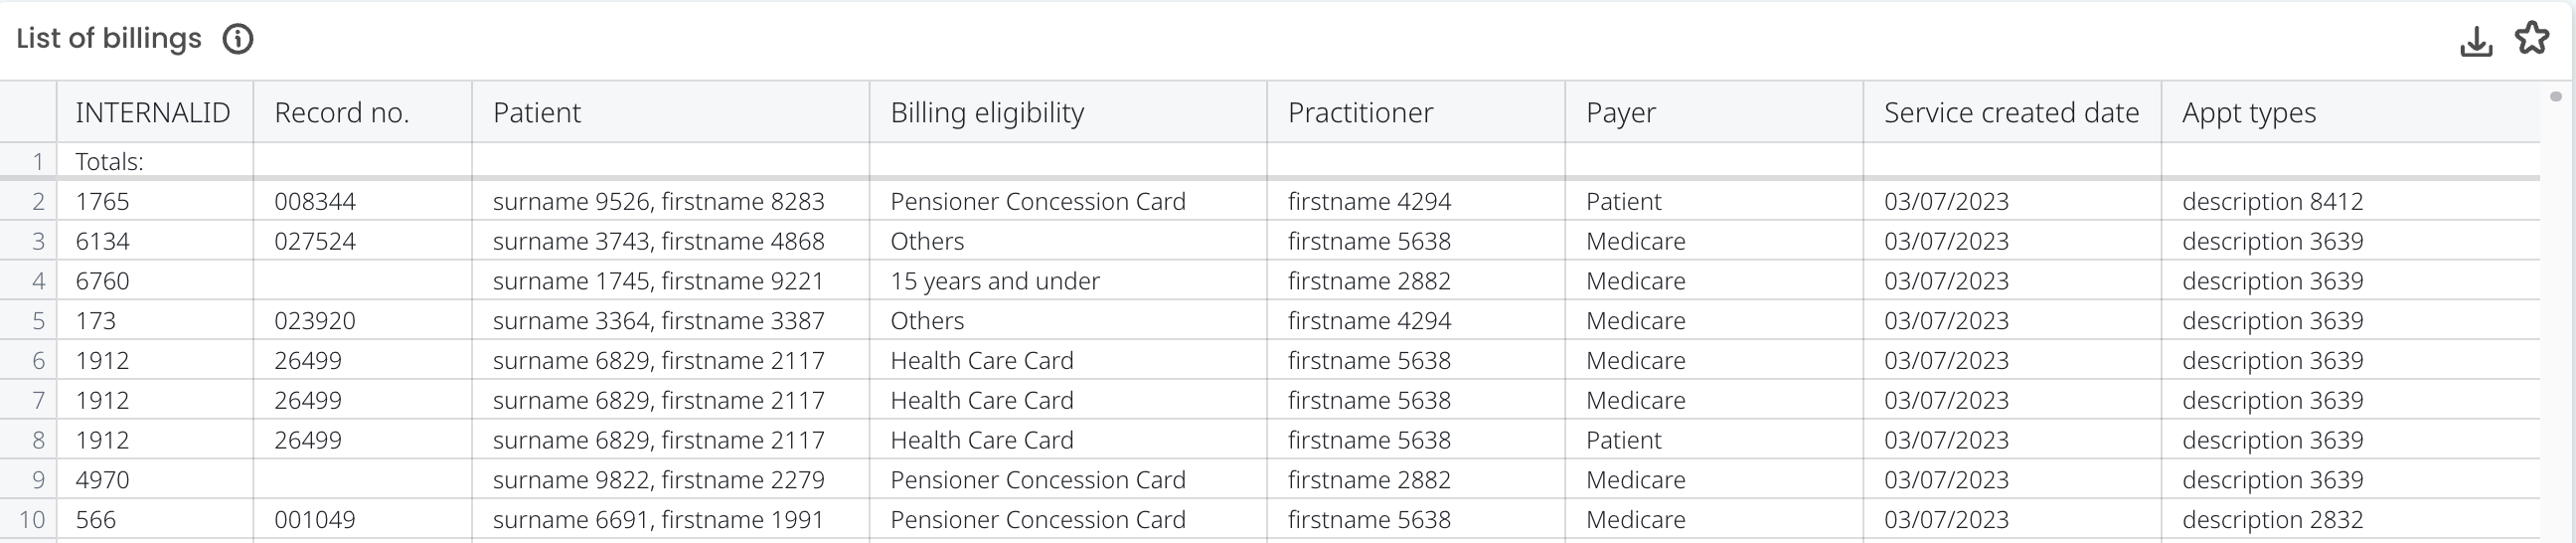
Use the filters to refine this list to the specific data for your Practitioners or even for specific item numbers as well.
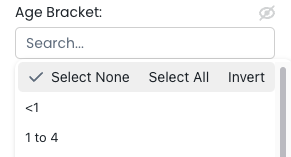
TOP TIP! Use the "Age bracket" filter to filter your list of billings into age brackets. Here you can select one bracket or multiple:
NOTE: If you want to print this table, you can download it as a .csv file (to open in Excel) by clicking on the download arrow on the right-hand side of the table.