
This metric can assist in your decision to move away from the bulk-billing business model and into a mixed or private billing model. You can also use it to periodically review your practice performance across a variety of areas, relating to the private gap fee being charged to patients.
To navigate to this metric, go to Clinic Optimisation > Billing Optimisation > Private Billings Gap

This metric will only include the private gap paid on billings of MBS items*, and will not include DVA schedule items or custom item numbers. *Based on the MBS fees as of January 2022.
The sections included in this article relating to Private billings gap are:
- Average private gap by Practitioner
- Average private gap
- Average private gap by day of week
- Trend of average private gap
- Private gap distribution
- Average private gap by MBS item
- Average private gap by standard consults
- Average private gap by consult type
Average private gap by Practitioner
This metric shows the average private gap by Practitioner. This average is calculated on all MBS items privately billed by the Practitioner, excluding any services that have been discounted, where the fee is less than the Medicare rebate.
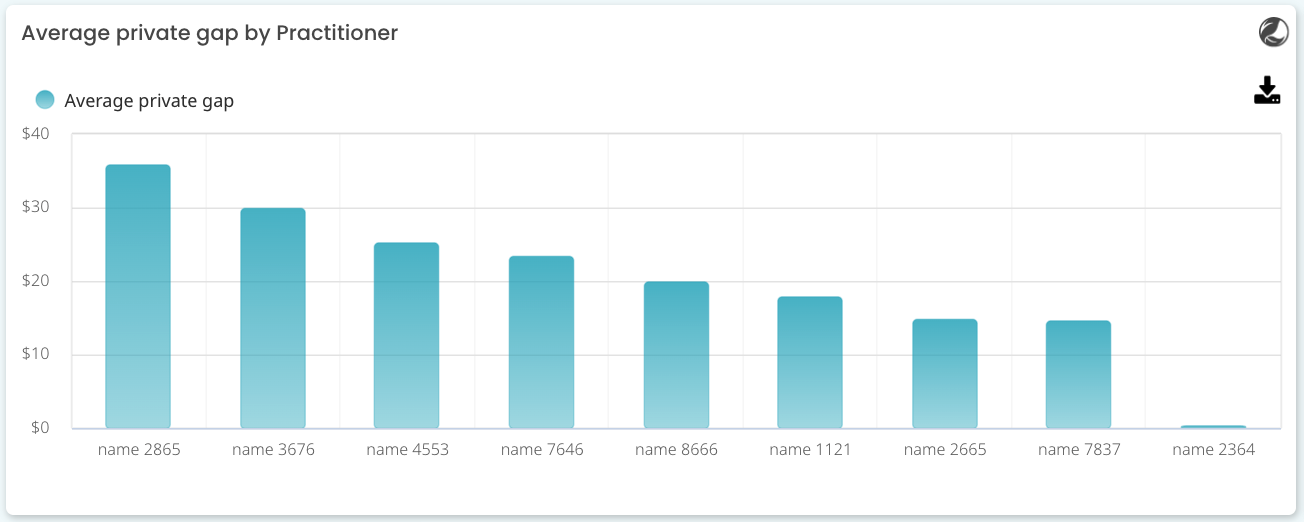
By checking this metric, you can start to understand which Practitioner is more familiar or more comfortable with charging higher private fees to patients. This metric may also help you understand which Practitioners you may need to work with continuously, in order to have an impact on the overall billings of the Practice.
Average private gap
Your average private gap is the difference between what the MBS rebate usually is, and what your practice privately charges. This metric represents the average private gap charged for each MBS item privately billed in the selected date range.

Please note that this metric will only include the private gap paid on billings of MBS items (not private or custom items that have been added by the Practice). It will also, not include DVA schedule items.
For example, a standard 23 consult is currently worth $39.10 in benefits from Medicare. If your practice chose to charge privately for this, say $75 - the difference is the private billings gap, in this case, it would be $35.90.
It is worth bearing in mind that the above example is for a 23 only, so when we calculate your average private billings gap - we are looking at all the Medicare items you privately charge at your practice for all Practitioners and the difference between those private fees and the MBS rebate available for them. This can also vary by Practitioner (see above).
TOP TIP: You do have the ability to filter these metrics, by selecting specific items and Practitioners in the filters. Or you can see the comparisons in the charts available on this screen. For example, use the Select Role filter to see only your Doctor's private billings gap.
Average private gap by day of week
This metric shows the average private gap for Weekdays as compared to Saturdays and Sundays (if data is available and your practice is open). We compare the days on the weekends separately because practices are more likely to charge a higher gap over weekend days.
It is important that your Practitioners understand the value of their time. Showing your Practitioners this information could help them to understand what patients are willing to pay for quality services, by comparing that same service that they deliver during the week.

Trend of average private gap
This metric shows the average private gap for the selected date range. This average is calculated on all MBS items privately billed, excluding any services that have been discounted to where the fee is less than the Medicare rebate.
Using this trend metric, you can start to understand if your private gap fees are increasing or decreasing over time.
You can use the Select Items filter to select only your GP consulting items, such as 3, 23, 36 and 44, to see how the average private gap for those items only has changed over time.

TOP TIP! If you would like to look at an extended period, change the date filter to 'this year' and 'group by' within the metric, to month. This will give you a great overview of how your gap is trending for the current calendar year.
Private gap distribution
This metric shows for each private gap range, how many services were billed. This chart can provide insight into the distribution of your private billing.
For example, in the below metric you will see that the private gap distribution breakdown shows that there were almost 20 services where the private gap payment was $10 and under.

You can use this metric to determine where you are currently sitting in terms of your private billings gap. If your practice falls within the lower gap distribution, you may decide to start increasing your private gap fees incrementally.
You could also use this distribution tracker to gauge how this distribution changes over time.
For example, your goal could be to increase your average private gap to $35, so you want to see the majority of your services falling within the $40 and under range.
TOP TIP! Remember to use the date filter to check back historically and understand this distribution and how it has changed over time.
Average private gap by MBS item
This metric shows the average private gap by MBS item. This average is calculated on all MBS items privately billed, excluding any services that have been discounted to where the fee is less than the Medicare rebate.
Which items are your patients currently paying for privately? Reviewing this metric will give you insight into where to head next.

TOP TIP! Use this metric and the Average private gap by standard consults and by consult type in conjunction with your billing policy. They can be used to periodically review your goals.
For example, in the above metric, maybe item 44 should be making an appearance on this graph? Or perhaps you would like to increase the value of the private gap for item 23?
Average private gap by standard consults
This metric shows the average private gap for each level of standard consult. This average is calculated on all MBS items privately billed, excluding any services that have been discounted to where the fee is less than the Medicare rebate.

TOP TIP! Do your Practitioners regularly bulk-bill short (level A) consults? Perhaps you want to encourage your Practitioners to charge as per your Mixed Billing policy, which may include a private fee for short consultations?
Average private gap by consult type
This metric shows the average private gap for each type of consult:
- Telehealth (video)
- Telephone (phone)
- Face to Face (in person)
This average is calculated on all MBS items privately billed, excluding any services that have been discounted to where the fee is less than the Medicare rebate.

Ensure that you utilise the date filters and periodically check these metrics, so you can understand your practice performance.
TOP TIP! Review your average private gap by consult type if your Practitioners are seeking to adjust towards or away from Telehealth in your practice.