
The prescribed pattern of services metric can be found under Clinic Optimisation > Billing optimisation > Prescribed pattern of services.
Use this metric to help ensure compliance across your practitioners to protect against the risk of an audit.
Use this as a quick glance metric and ensure that it stays 0!

These two figures represent an overview of the services your Practitioners are providing in regard to the Department of Health & Aged Care 'Prescribed pattern of services' rules.
NOTE: More information about these rules can be found on the Department of Health & Aged care website Prescribed pattern of services-the 80/20 and 30/20 rules.
The sections included in this article relating to the Prescribed pattern of services are:
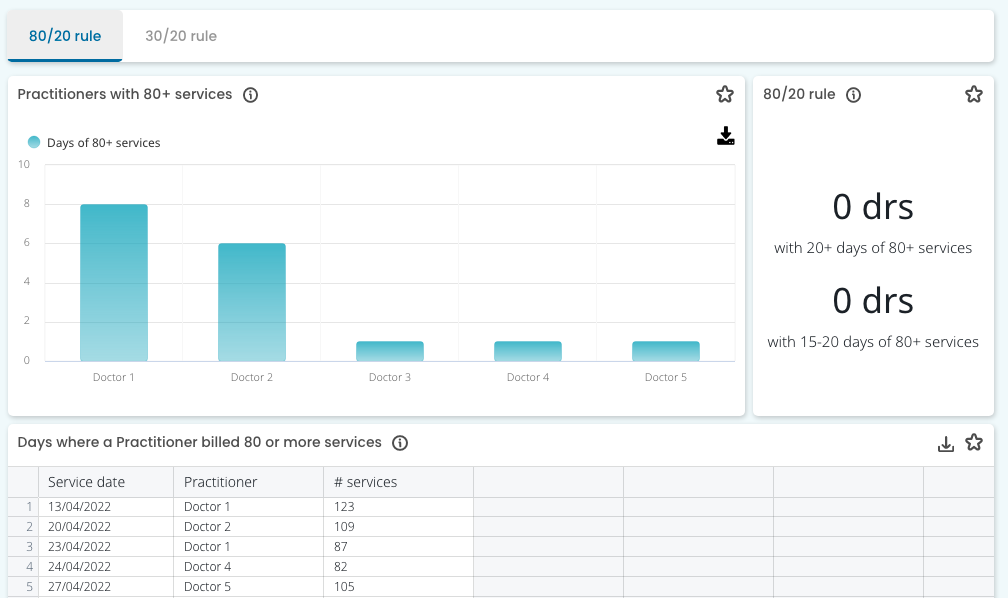
80/20 rule tab
This metric shows the number of Practitioners that have rendered 80 or more professional attendance services on each of 20 or more days in a 12-month period. Here you will find the details of the service dates and the number of services for when this has occurred.
Use this metric to help ensure compliance across your Practitioners to protect against the risk of a breach.
NOTE: More information about these rules can be found on the Department of Health & Aged care website Prescribed pattern of services-the 80/20 and 30/20 rules.
Practitioners with 80+ services
This metric provides a graph of each practitioner with a day of 80+ services and how many days there were 80+ services.
If no Practitioners are shown in your graph, then you have no Practitioners who have rendered 80 or more services on any one day in the previous 12-month period.

TOP TIP! Use this metric to have educational discussions with your Practitioners. Using data as a way to empower the team. You can also export the below list of Days where a Practitioner has billed 80 or more services and provide it to the Practitioner where appropriate.
80/20 rule
This metric provides the total number of Practitioners that have rendered 80 more professional attendance services on each of 20 or more days in a 12-month period.
There is a second measurement here that highlights the number of Practitioners who are close to this limit, having rendered 80 more professional attendance services on each of 15 or more days in a 12-month period.

TOP TIP! If any Practitioners show in the 15-20 days metric for 80+ services, you can use this to alert those Practitioners that they are close to breaching the 80/20 rule and can take appropriate measures to avoid this breach.
Days where a Practitioner billed 80 or more services
This list details the dates when a Practitioner has rendered 80 or more professional attendance services. This is useful to see when the breach of the 80/20 rule occurred and how many times. Use it to notice trends and export the table to provide evidence to your Practitioners about the breach.
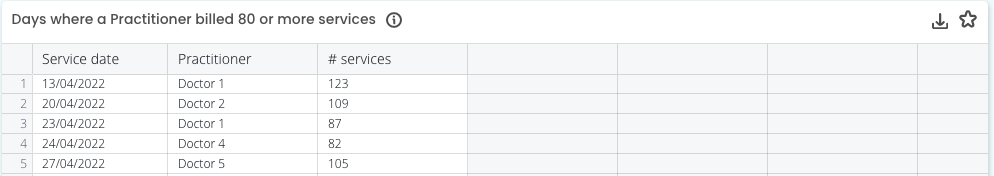
TOP TIP! You can filter this list by Practitioner using the filter in the sidebar to provide each Practitioner with a list of the days where they have exceeded 80+ services.
30/20 rule tab
This metric shows the number of Practitioners that have rendered 30 or more relevant telephone attendance services on each of 20 or more days in a 12-month period (from 1 October 2022). Here you will find the details of the service dates and the number of services for when this has occurred.

Use this metric to help ensure compliance across your practitioners to protect against the risk of a breach.
NOTE: More information about these rules can be found on the Department of Health & Aged care website Prescribed pattern of services-the 80/20 and 30/20 rules.
Practitioners with 30+ services
This metric provides a graph of each practitioner with a day of 30+ services and how many days there were 30+ services.
If no Practitioners are shown in your graph, then you have no Practitioners who have rendered 30 or more telephone attendance services on any one day in the previous 12-month period.
TOP TIP! Use this metric to have educational discussions with your Practitioners. Using data as a way to empower the team. You can also export the below list of Days where a Practitioner has billed 30 or more services and provide it to the Practitioner where appropriate.
30/20 rule
This metric provides the total number of Practitioners that have rendered 30 more relevant telephone attendance services on each of 20 or more days in a 12-month period (from 1 October 2022).
There is a second measurement here that highlights the number of Practitioners who are close to this limit, having rendered 30 more relevant telephone attendance services on each of 15 or more days in a 12-month period.

TOP TIP! If any Practitioners show in the 15-20 days metric for 30+ services, you can use this to alert those Practitioners that they are close to breaching the 30/20 rule and can take appropriate measures to avoid this breach.
Days where a Practitioner billed 30 or more services
This list details the dates when a Practitioner has rendered 30 or more relevant telephone attendance services. This is useful to see when the breach of the 30/20 rule occurred and how many times. Use it to notice trends and export the table to provide evidence to your Practitioners about the breach.
TOP TIP! You can filter this list by Practitioner using the filter in the sidebar to provide each Practitioner with a list of the days where they have exceeded 30+ services.