
This metric can be found in Clinic Optimisation > Appointment optimisation
This metric shows the number of active patients as per RACGP guidelines (3 visits in the past 2 years) as well as the total number of patients marked as active in their demographics in the practice database.
Database patients include all active and inactive patients. Click into this metric to breakdown by date range, age and more.

The sections included in this article relating to Practice demographics are:
- Watch our Coffee and Cake Webinar on this topic
- Active patients
- New patients
- Item count
- Practice cohort: Age
- Monthly attending patients: Age
- Practice cohort: Concession card
- Monthly attending patients: Concession card
- Practice cohort: Gender
- Monthly attending patients: Gender
Watch our Coffee and Cake Webinar on this metric!
TOP TIP! Use the filter "Include patients with only covid vax billings" to include patients with only covid vaccine item billings in your practice in your data.
Tick the box to apply the filter as below:

Active Patients
This figure shows the number of active patients as per the RACGP Guidelines (3 or more visits in the past 2 years). Database patients include all patients marked as active in their demographics in the practice database.

NOTE! The Royal Australian College of General Practitioners states that an active patient is someone who has attended your practice on at least three occasions in the last two years. Active patients are an important part of the conversation during accreditation, so it's really worthwhile to have this information on hand.
We have added a checkbox in the sidebar so that you can see these demographics by age, gender and concession card by those patients defined as 'active' by the RACGP. Just tick the checkbox Patients with 3+ appts in 2 yrs and the information displayed will be filtered to show only these patients.
New patients
This figure shows the number of appointments attended by new patients in the full three calendar months prior to today's date.

This metric also shows if your new patient numbers are in decline or going up, based on the graphic, over time.
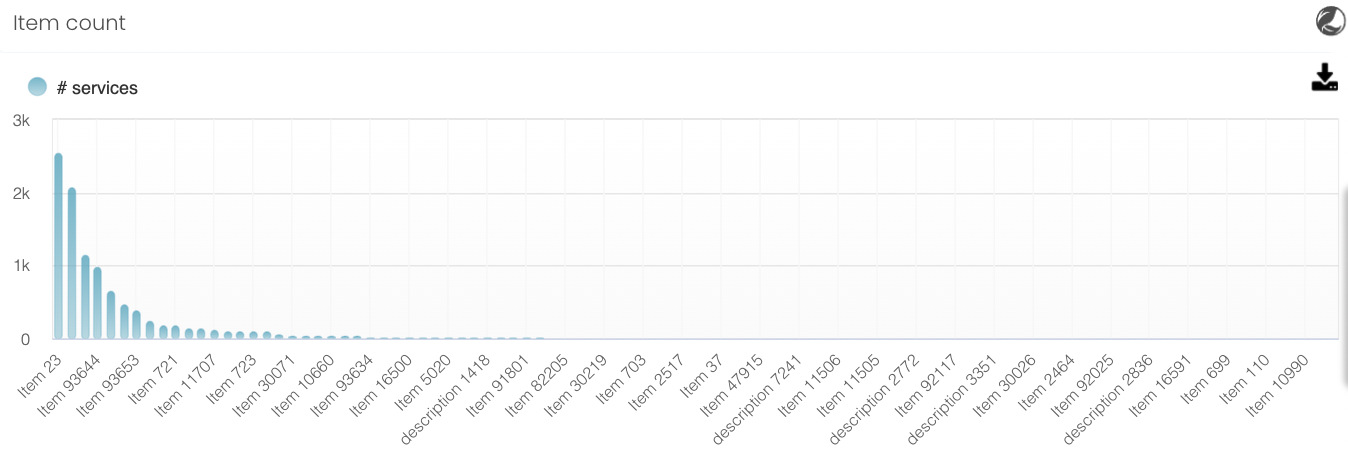
Item count
This graph shows, by MBS item number, the number of services provided to new patients (i.e. attending their first appointment at the practice) in the full three calendar months prior to today's date.
Practice cohort: Age
This metric shows the age breakdown of those patients marked as ‘Active’ and not marked as ‘Deceased’ or 'Inactive' in your database.
Tick the checkbox filter Patients with 3+ appts in 2 yrs to show only active patients as per RACGP guidelines.

Monthly attending patients: Age
This metric shows the breakdown by age, for all patients attending the practice by month for both the current month, and the previous three months.
Tick the checkbox filter Patients with 3+ appts in 2 yrs to show only active patients as per RACGP guidelines.

Practice cohort: Concession card
This metric shows a breakdown of patients who have attended the practice and their status regarding whether they have a concession card, health care card, seniors health card recorded on their patient file.
Those categorised as ‘Not Specified’ have no card listed in their patient demographics.

Monthly attending patients: Concession card
This metric shows a breakdown of patients who have attended the practice and their status regarding whether they have a concession card, health care card, seniors health card recorded on their patient file.
Those categorised as ‘Not Specified’ have no card listed in their patient demographics.
This graph also shows data on all active patients attending the practice each month over the last 4 months.

TOP TIP! Using these visualisations, you can start to understand links to issues your practice may be facing. For example, if you have seen an increase in bulk billing, perhaps there has also been an increase in attendances by concession cardholders. This could lead you to review your bulk billing policies, in regard to the other demographics, or start to look more closely at your marketing strategies.
Practice cohort: Gender
This metric shows the breakdown by gender for all active patients currently registered at the practice. Tick the checkbox filter Patients with 3+ appts in 2 yrs to show active patients as per RACGP guidelines.

Monthly attending patients: Gender
This metric shows the breakdown by gender for all active patients attending the practice each month over the last 4 months.

TOP TIP! There are additional filters that you can use to refine the data further. For example, you can select multiple filters to show those patients who are within a certain age bracket, then identify what portion of active patients are attending the practice and what gender and concession card status they have recorded on their patient file.