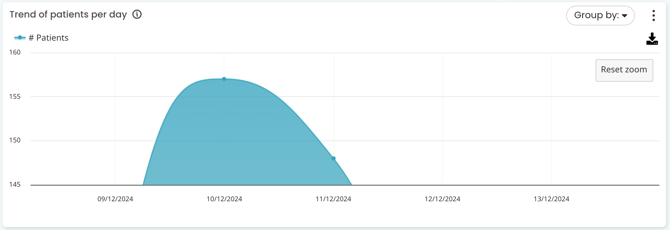
This metric shows the average number of patients seen per day over the selected timeframe. You can also check in on this to see how it changes over time, which can assist in understanding your patient base and identifying any fluctuations.
To navigate to this metric, go to Summary > Healthy Practice Indicators > Appointments per day
The sections included in this article relating to the Patients per day metric are:
Appointments per day by Practitioner
This figure represents the average number of appointments seen by each Practitioner per day over the selected timeframe.
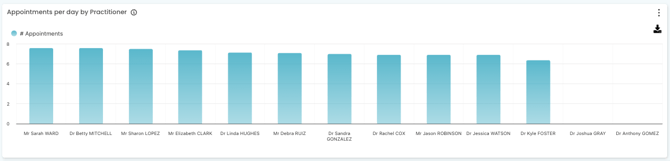
You can easily view here which Practitioner is seeing the most patients, on average.
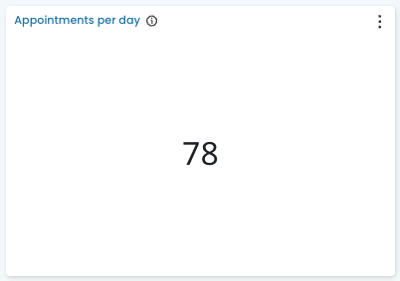
Appointments per day
This figure represents the average appointments per day over the selected timeframe.

TOP TIP! You can filter this metric to Role to see average number of appointments per day for Doctors and Nurses in your practice for the selected timeframe.

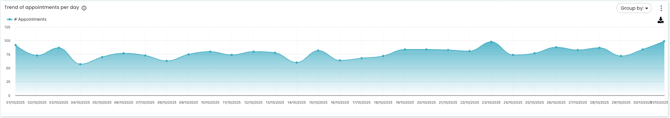
Trend of appointments per day
This figure represents the average number of appointments per day, over time. You can use the horizontal axis to see this by day, week, month or quarter, or year using the Group by filter.
TOP TIP! Use our Zoom feature for graphs to zoom in to a particular date range to understand what was going on during that period.
Hold down your left mouse button and select a period on the graph for the zoom feature to activate. Click the Reset zoom button to return to your original view.