Pathology and imaging
Track the number of pathology and imaging requests sent by your practice. Review which pathology providers you are engaging with most frequently and the type of tests (Imaging or Pathology) are being requested.
NOTE: This metric is available to our Best Practice software integration customers.
To access/view data within this metric, your practice will need to have HALO Connect installed and updated as your data extraction method.
For information on how to update to Halo, refer to our guide HERE
This metric shows the data on the pathology and imaging requests sent by your practice in the selected date range, and the incoming results.
You can find this metric by going to Clinic Insights tab > Past Clinic Metrics > Operations tab > Pathology and imaging
The sections included in this article relating to Pathology and Imaging are:
- Pathology
- Imaging
- Pathology and Imaging tests, by Practitioner
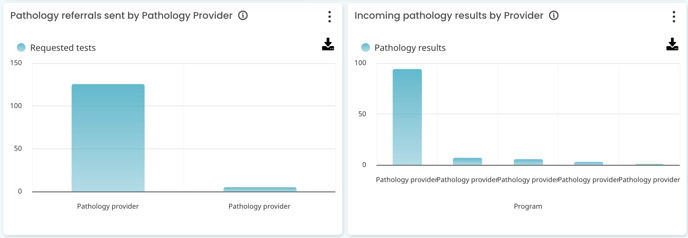
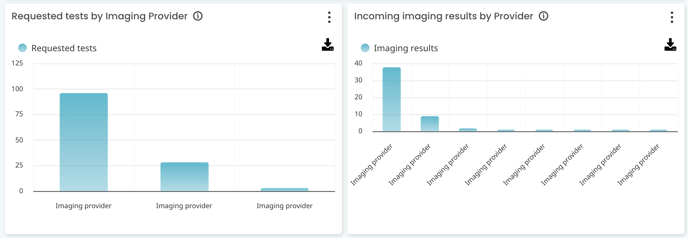
- Requested tests and number of results, by Pathology and Imaging Provider
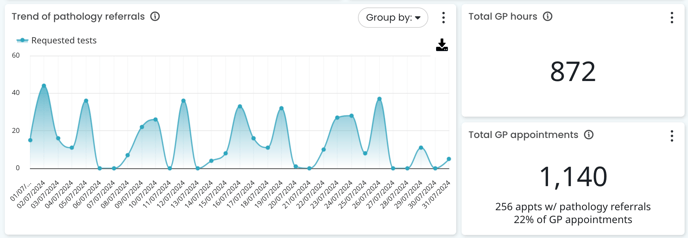
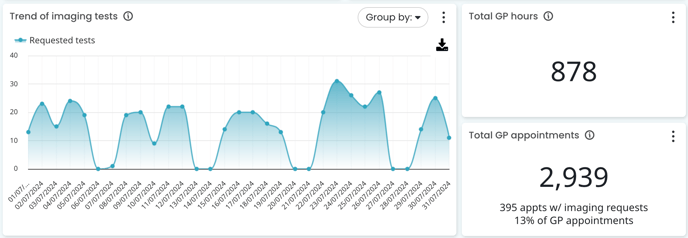
- Trend of referrals and tests requested, and GP hours/appointments
- List of requested tests
- Uncategorised
- Pathology and Imaging settings in your Practice Management Software (PMS)

TOP TIP! Use this metric to also assist with Achieving Accreditation Success with Cubiko by showcasing how you are meeting Criterion GP2.3 - Engaging with other services.
Pathology referrals
This metric shows the number of pathology referrals at the practice in the selected date range. Please note that a pathology referral may include more than one individual test request.
Incoming pathology results grouped by unique patient referral
Cubiko defines a unique patient referral as a single instance where a Practitioner provided a pathology referral to a patient. When these individual tests are returned, Cubiko groups them to count as a single unique referral episode. This measure can help the Practice to get a sense of how many pathology referrals are being filled, despite the absence of a direct link in the data between outgoing referrals and incoming results.
Telehealth % of billings
This metric shows the % of total billings that were telehealth in the selected date range.

Imaging
Imaging requests
This metric shows the number of imaging requests at the practice in the selected date range.
Incoming imaging results
This metric shows the number of incoming imaging results at the practice in the selected date range.
Telehealth % of billings
This metric shows the % of total billings that were telehealth in the selected date range.

TOP TIP! How do you currently send your imaging requests? Do patients take them at the end of the consultation? Do your team scan and send on behalf of the patient? Or do you complete a hybrid of these? Knowing how many outgoing requests you are sending can assist you in managing your processes and the requirements of your team.
Pathology and Imaging tests, by Practitioner


TOP TIP! Review the number of tests your practitioners are sending out - do you have any providers not requesting additional investigations?
Is this something that may need to be reviewed or discussed in clinical meetings to ensure the doctor is aware of further testing options?
Requested tests and number of results, by Pathology and Imaging Provider


TOP TIP! Do you have a pathology lab in your practice - see the volume of tests being referred to that lab - this can be very helpful when negotiating to extend lab opening hours, rental amount, etc.
Use the filters to see specific practitioners' or providers' data over a selected date range: 
Trend of referrals and tests requested, and GP hours / appointments
Trend
Total GP hours
Total GP appointments


TOP TIP! Use the date filter to extend the range you are reviewing. Do your trends increase/decrease at different times of the year? Compare this to other projects or activities you are doing - how might they be influencing each other.
These lists show all pathology and imaging requests made from your practice over the selected timeframe.


TOP TIP! Use this list as an audit tool to cross-check which requests have been completed and returned, and which requests remain outstanding and may require follow-up.
The status column will indicate the requested test status in your practice software - Sent/Received/Unknown.
You can also check if the requested provider is then the servicing provider to see if patients are attending different providers than your practice/practitioner preference.
Uncategorised
This table lists the providers that Cubiko has not been able to categorise as Pathology or Imaging. If there is a provider in this list that you recognise as a Pathology or Imaging provider, let Cubiko know and we will include them in your metrics.

Pathology and Imaging settings in your Practice Management Software (PMS)
Review the key Pathology and Imaging settings in your Practice Management Software (PMS) that may impact the metrics displayed in the Pathology and Imaging cabinet.
Note! The examples below are from your PMS. For questions or further guidance on how to perform these actions, please contact your PMS provider directly.
1. Duplicate contacts being set up in your PMS
Duplicate providers may appear in your Cubiko data due to duplicate contacts in your Practice Management Software (PMS).

This will need to be reviewed and updated in your Practice Management Software.
- For Best Practice go to Contacts for review:

Here you can search via categories such as "Pathology" or "Imaging" and review the contact names to view duplicates.
From here you can merge contacts so you have one contact for each service provider:

2. No preferred provider preferences set up
If no preferred provider is set, and practitioners do not manually select a provider when making a referral, it will print without being addressed to any specific service provider. This will show as "Name not provided" in your Cubiko data.
This will need to be reviewed and updated in your Practice Management Software.

- For Best Practice go to preferences> Pathology and/or imaging for each practitioner. Here you can select a service provider and tick as the preferred provider:

This will then default as the provider when doing a referral unless changed:
