
By diving deeper into this metric, you can start to understand how many new patients each Practitioner is seeing over a period of time.
To navigate to this metric, go to Clinic Insights > Past clinic metrics > Diaries tab > New patients

This figure represents the number of patients who attended their first appointment in the selected period and how many of those booked through your online booking system.
The sections included in this article relating to New patients are:
- New patients by Practitioner
- % of new patients who returned for 3+ appts
- New patients by appointment type
- Average new patients by weekday
- New patients over time
- New patient appointments
New patients by Practitioner
This figure represents the number of patients who attended their first appointment in the selected period broken down by conventional (booked through reception) and online bookings, split by Practitioner.
New patients are counted when it is their first consultation/visit with the practice regardless of the appointment type booked.

TOP TIP! Here you can start to understand how many New patients by Practitioner are seen over this time period. Are some Practitioners getting the majority of new patients, or should they be more evenly distributed? How are these patients booking into the Practice, online or via ‘conventional’ methods (booking over the phone with a receptionist)?
% of new patients who returned for 3+ appts
The total number of patients whose first appointment fell within the selected period, what percentage of those have become regular patients of the practice, returning for a total of three or more appointments.

TOP TIP! Is your Practice retaining new patients that attend? Select a longer time period and different Practitioners from the drop-down filter to see if some Practitioners have a higher or lower retention rate than others.
New patients by appointment type
This figure represents the number of patients who attended their first appointment in the selected period broken down by conventional and online bookings, split by the first appointment type.

TOP TIP! This chart will default to showing you the Top 10 appointment types (the top appointment types completed with the greatest number of new patients). Use the filter on the graph to see more appointment types booked by new patients.

Average new patients by weekday
This metric represents the average number of patients who attended their first appointment in the selected period broken down by day of the week. The metric allows you to filter this data by Practitioner and compare online conversion versus conventional methods.
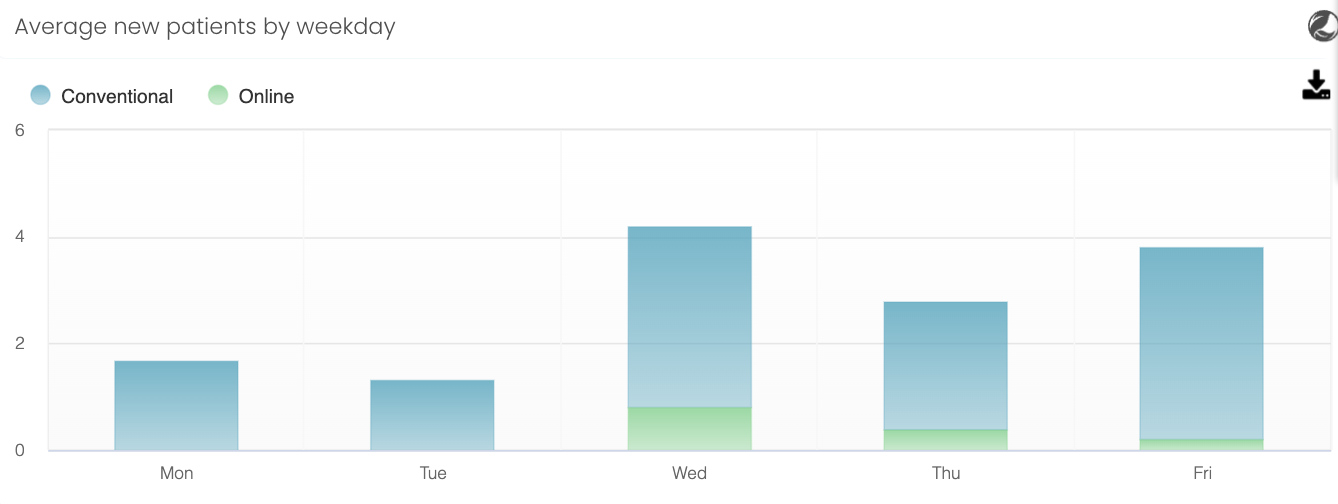
TOP TIP! This metric will help you start understanding when new patients are coming to your practice. Do you have limited capacity for new patients on certain days of the week? Perhaps you could use this information to look closely at the schedules for your Practitioners.
New patients over time
This figure represents over time the number of patients who attended their first appointment in the selected period. The metric allows you to filter this data by Practitioner and compare online conversion versus conventional methods.
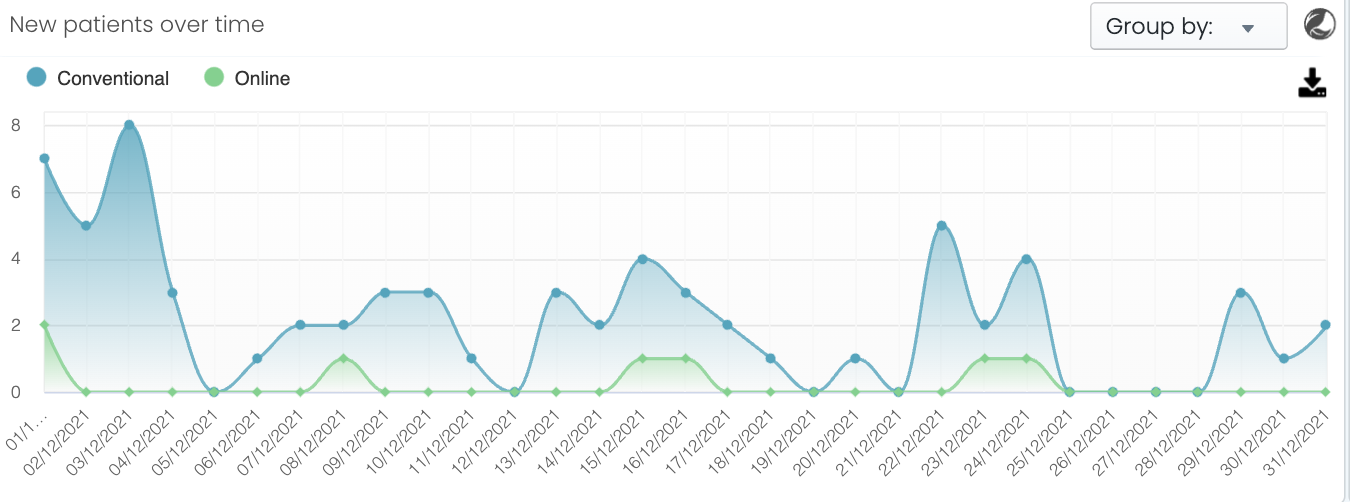
Use the Group by drop-down filter on the graph to view the data by day, week or month.
New patient appointments
This table shows the appointment details of patients whose first appointment was in the selected period.
The column with # of completed appts counts the number of appointments from that first visit up until yesterday.
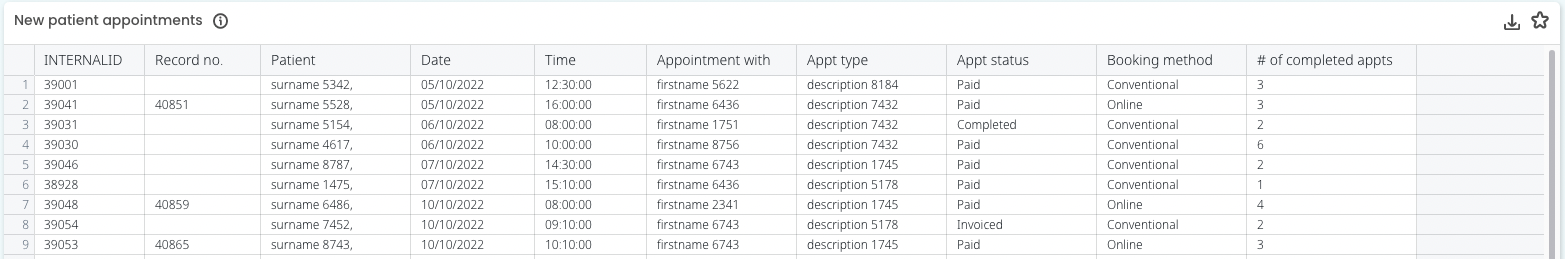
You can sort by any column to see the data differently, for example, by booking method or by the number of completed appointments.
TOP TIP! In this list, you can see how many completed appointments patients have had. If they have only had one and are not coming back in, maybe there is a good opportunity to touch base with them for some honest feedback about your Practice and ways you can improve.
Our patient lists in Cubiko provide the Best Practice INTERNALID, which can be used by third-party software applications that integrate with Best Practice, to enable sending of SMS to these patients CLICK HERE for more information on how to do this.