MBS Benchmarking
How does my practice compare to National and State benchmarks? We've created this dashboard to answer precisely that question!
This cabinet allows you to compare how your practice is performing against National and State benchmarks. The metrics within this cabinet are based on the data released by the MBS each month containing information regarding how many services of each MBS item have been billed. You can use this data to assess the effectiveness of the activities you’re performing within your practice.

To navigate to this metric, go to Clinic Insights > MBS Benchmarking
1. Dates: Select which date period/s you would like to use to benchmark.
2. Practitioners: Select which practitioner/s you would like to use to benchmark. Or leave this blank and look at your practice data as a whole.
3. Billings: Our benchmarks default to using national data. But if you would like to compare against state data select your state from the dropdown menu above.

4. Appointments: Click on the button of either Standard consults, Telehealth consults, GPMP/TCA/REVIEW/10997s, or Std Consult/CDM/HA benchmark options in order to change the context of the charts on the current page. Clicking on one will give you a breakdown of that data into the sections listed below.
Standard consult type: By default, we will be showing all standard consultation types (as defined by MBS - see additional resources) including consults In consulting rooms, Out of consulting rooms, and RACF consultations. You will be able to filter onto specific consult types by selecting them in this field.

Standard consult attendance: By default, we will be showing all attendance items (as defined by MBS - see additional resources) including attendances during Business hours, After-hours, and Telehealth/Telephone attendances. You will be able to filter onto specific attendance types by selecting them in this field.

NOTE: We rely on the monthly data that is released by the MBS. Cubiko will update this once the information is released.

TOP TIP! Clicking on each of the 4 benchmarks above will update the metrics below, changing the charts and visualisations displayed below making them relevant to the selected KPI. We have broken each category into how your practice is performing, the MBS benchmark for the chosen category, and the variance between your practice and the benchmark.
The sections included in this article relating to the MBS benchmarking are:
- Benchmark options
- My Performance
- MBS Benchmark
- Practitioner breakdown
- Variance
- Comparison
- Item numbers included in the Benchmarks
Benchmark options
Each of these icons are clickable! This symbol means that you can click on this metric in order to change the context of the charts on the current page.
Standard Consults - Benchmark
This metric shows the benchmark for the proportion of each level of standard consults Level A, B, C, or E (including their telephone and telehealth equivalents).
Telehealth consults - Benchmark
This metric shows the benchmark for the proportion of face-to-face, telephone and telehealth (video) consults.

GPMP/TCA/Review/10997s - Benchmark
This metric shows the benchmark for the proportion of GPMPs, TCAs, Reviews and 10997s (including telephone and telehealth equivalents).

Std Consult/CDM/HA - Benchmark
This metric shows the benchmark for the proportion of standard consults to Health Assessments and to GPMPs, TCAs, Reviews and 10997s (including telephone and telehealth equivalents).

My Performance
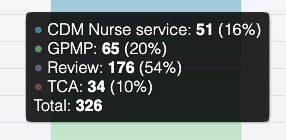
This metric shows the proportion of items billed at your practice for the selected Benchmark. For example selecting the GPMPs, TCAs, Reviews and 10997s symbol. The data will then reflect the proportion of CDM nurse service (10997), GPMP, Review and TCA items billed in your practice over the selected time period.
The other charts on this page (MBS Benchmark, Practitioner breakdown, Variance and Comparison) will also reflect this benchmark. We have used this benchmark as the example for all the below data however, changing your benchmark selection will update these graphs for each of the four benchmarks.

TOP TIP! Hover over the graph to view a breakdown of the number of services provided and the percentage of each service billed.

MBS Benchmark
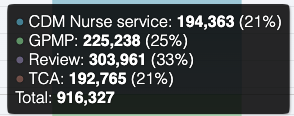
This metric shows the benchmark for the proportion of GPMPs, TCAs, Reviews and 10997s (including telephone and telehealth equivalents) billed Nationally or Statewide depending on your selected option from the filters at the top of the page.

TOP TIP! Hover over the graph to view a breakdown of the number of services provided and the percentage of each service billed.

Use this graph in comparison with the 'My Performance' graph to see where your practice is sitting for each CDM item in comparison with the rest of Australia OR State-wide depending on your selected option from the filters at the top of the page.
If you select the Benchmark Telehealth consults you can view your performance in comparison to your State or Nationally for Telehealth, Telephone and face-to-face services to see the impact on Covid on your clinic in comparison to others.
Practitioner breakdown
This metric gives you a breakdown of the proportion of GPMPs, TCAs, Reviews, and 10997s (including telephone and telehealth equivalents) billed in your practice by service and Practitioner.

TOP TIP! Use this graph for a comparison of where each of your Practitioners is sitting in the clinic for CDM billings. Here you can identify if you have Practitioners claiming GPMP & TCA billing and under-utilising CDM nurse services or Reviews.
This can help you determine which Practitioners need more nursing support in relation to CDM. Use this in conjunction with your Item Optimisation metrics for Practitioners that need help in boosting CDM item number billings.
Variance
This metric shows your variance from the benchmark for the proportion of GPMPs, TCAs, Reviews and 10997s (including telephone and telehealth equivalents). It shows whether your practice billed a higher proportion than the benchmark or if your practice billed a lower proportion than the benchmark.

Comparison
This table shows the number of items your practice billed, compared to the benchmark and your variance from the benchmark for the proportion of GPMPs, TCAs, Reviews and 10997s (including telephone and telehealth equivalents).

Item numbers included in the Benchmarks
Below is a table outlining the item numbers included in each of the benchmarks on our MBS Benchmarking page.
| Standard Consults |
3, 23, 36, 44, 123 - Standard Consults 91790, 91800, 91801, 91802, 91920 - Telehealth 91795, 91809, 91810, 91811 - Telephone 91890, 91891, 91894, 93716, 93717 - Telephone 52, 53, 54, 57, 151 - Non-VR Standard Consults |
| CDM |
721, 723, 729, 731, 732 - Care Plans 92024, 92025, 92026, 92027, 92028 - Telehealth 92068, 92069, 92070, 92071, 92072 - Telephone 229, 230, 231, 232, 233 - Non-VR Care Plans 92055, 92056, 92057, 92058, 92059 - Telehealth 92099, 92100, 92101, 92102, 92103 - Telephone 10997, 10987 - Nurse CDM 93201, 93200 - Telehealth 93203, 93202 - Telephone 699 - Heart Health Check 177 - Non-VR Heart Health Check |
| Health Assessments |
701, 703, 705, 707 - Heath Assessments 224, 225, 226, 227 - Non-VR Health Assessments 715 - Indigenous Health Assessment 92004 - Telehealth 92016 - Telephone 228 - Non-VR 92011 - Telehealth 92023 - Telephone |
Additional Resources:
VR General Attendance Items: Medicare Benefits Schedule - Note AN.0.74
Non-VR General Attendance Items: Medicare Benefits Schedule - Note AN.7.2

