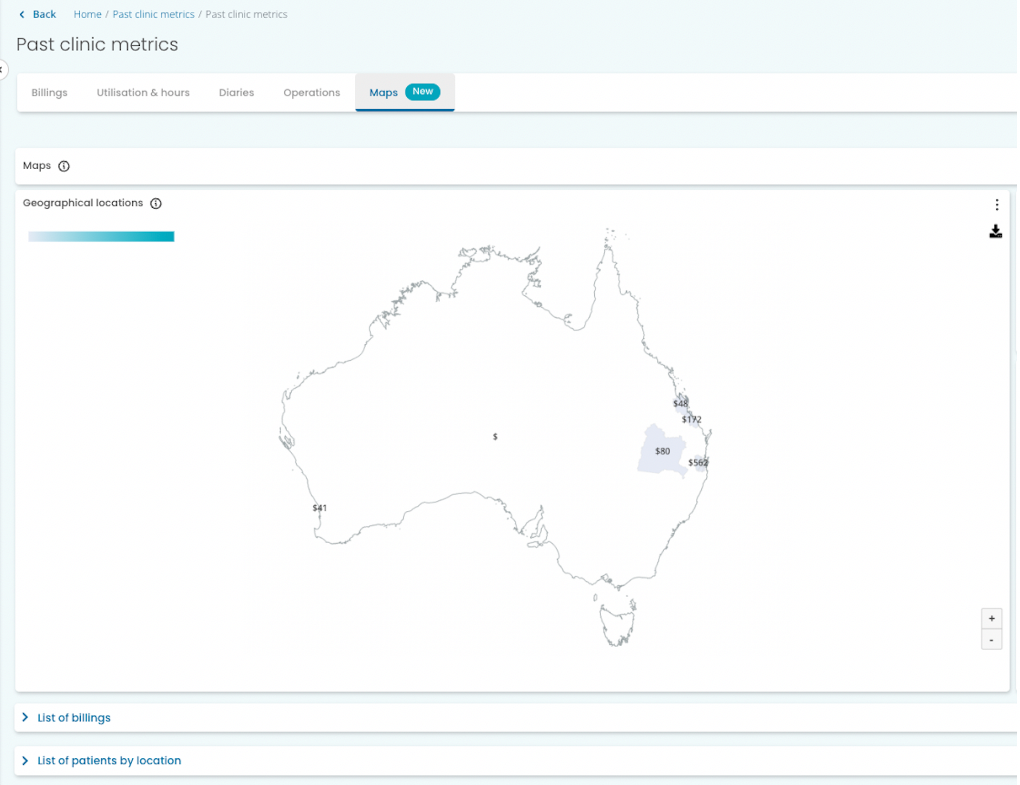
Maps
This page lets you explore different metrics about the practice based on the patient's home address.
To navigate to this metric, go to Clinic Insights > Past clinic metrics > Maps tab

Use the filters on the page by clicking on the drop-down arrows in the maps heading to select which metric and level of detail to display.
![]()
Here you can view your:
via:
- Region (default)
- Postcode
- State
when looking at your:
- Billings (default) -Total billings (by service date) inclusive of GST, and based on service date,
- Items billed - The number of services billed.
- Bulk billings -Total billings that have been bulk-billed by MBS/DVA item number, for patients who are eligible for bulk-billing.
- CDM billings - Total Chronic disease management (CDM) billings (items 721, 723, 732 and telephone/telehealth equivalent) inclusive of GST, and based on service date
- Completed appointments - Number of completed /invoiced/paid appointments over the selected timeframe
- New Patients - Number of patients who attended their first appointment in the selected period.
- Consulting hours - Total hours spent consulting for the period selected. Consulting hour includes all the patient appointment slots that are completed, billed, paid and booked (excludes DNA and double-booked appointments).
Geographical locations
This chart shows the selected metric broken down by patient address. The granularity of the region can be changed between postcode, state or region.

TOP TIP! Please select the drop-down menu with "Billings" as the default option and explore this data in the context of other essential reports, such as "New Patients."

This action will refresh your map and display the geographic distribution of "new patients" who visited your practice during the specified date range. This feature allows you to gain insights into the primary sources of your new patient influx and identify areas that might be worth considering for targeted marketing efforts to attract new patients.
Additionally, you have the flexibility to view this data based on region, postcode, or state.
Total
This figure represents the total across the practice for the selected filter metric.


Top 10 locations
This chart shows the top 10 geographical locations for the selected metric and level of detail.

TOP TIP! Is there a location on the list that might raise eyebrows? It's possible that some patients are travelling a considerable distance. To explore this, delve into the "List of patients by location" table below to identify these patients and the Practitioner they usually visit. It's conceivable that these patients are following a practitioner who recently relocated to your practice. You can also use this information to mark these patients in their charts and, as a courtesy, make sure all their pending services, such as health assessments and vaccines, are scheduled for a single visit to minimise the number of trips they need to make.
List of billings
This table lists the billings (inclusive of GST, and based on service date) for services that were rendered in the selected period. Note that Cubiko does not include information about Doctor disbursements.

TOP TIP! Use the filters on the left-hand side to filter your list down by particular region/s, postcodes/s and state/s.

List of patients by location
This table lists the details of all patients based on the selected filters.

TOP TIP! Click the download button to download your list into a csv. You can then use this list with your third-party software application to send bulk SMS.
