Item Breakdown
See your practice's number of items billed over the selected timeframe.
The metrics shows the number of items billed over the selected timeframe. It excludes providers not nominated under practice settings. Here you can drill down for a detailed breakdown of services performed by Practitioner and MBS Item.
This metric can be found Homepage > Summary > Practice operations summary > Item breakdown

The sections included in this article relating to Item breakdown are:
- Services billed by MBS item
- Item breakdown by % of services billed
- Number of services billed by Practitioner and item number
- Services billed by Practitioner
- Services billed by Practitioner and item number
Services billed by MBS item

This chart shows the number of services of each MBS item which were performed in the period selected which are listed in order of your most frequently billed items This is such a great visual metric to instantly see what items you have billed over this selected time period.
TOP TIP! Click on an item number from the chart to filter all information on the page via that item number.
Item breakdown by % of services billed

Select at least one MBS item number to see this chart, which shows the proportion of services of that item number performed by each Practitioner.
TOP TIP! Hover over the chart to see the practitioners name alongside the actual percentage of service billed for that item and the number of services billed during the selected date range.

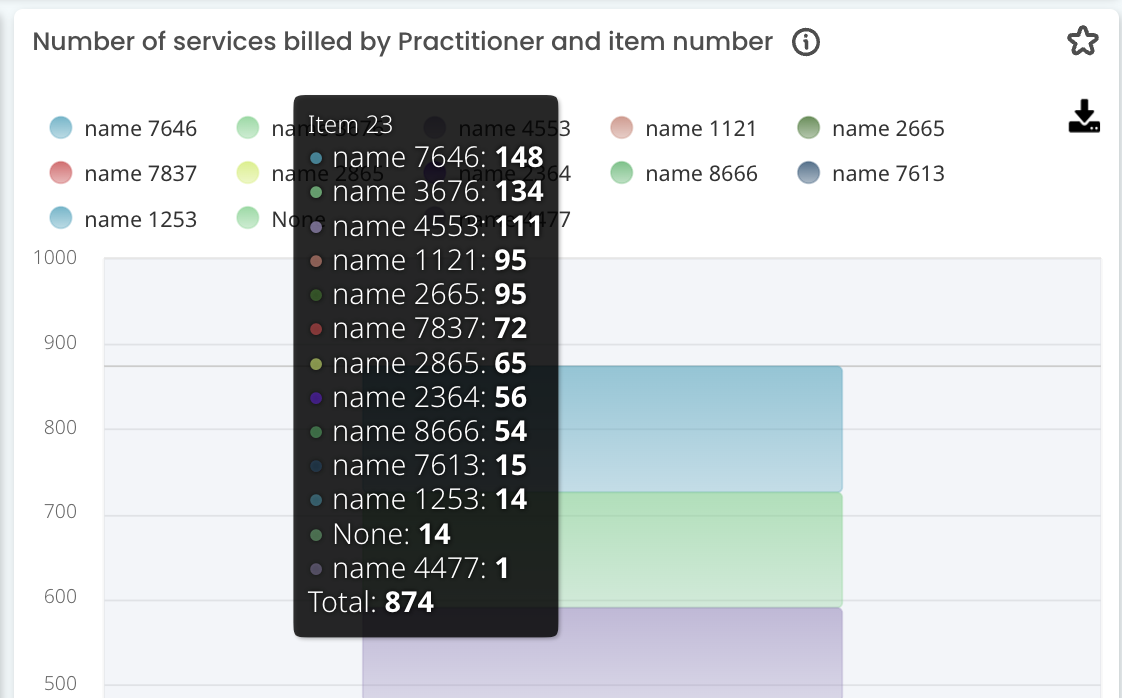
Number of services billed by Practitioner and item number

For the selected MBS item numbers, this chart shows the total number of services performed during the selected period, broken down by Practitioner.
TOP TIP! Hover over the chart to see the list of each practitioner billed for the item number you have selected- the example below is filtered on item 23. Here I can see how many services were billed for each practitioner over the selected date range. Use the filters on the page to filter different item numbers and practitioners.

Services billed by Practitioner

For the selected MBS item numbers, this chart shows the total number of services performed by each Practitioner, which can be compared against the services performed during the same period last year.
Services billed by Practitioner and item number

Compare the proportion of services performed for the selected MBS items by each Practitioner, and across the selected Practitioners.
TOP TIP! Use your filters on the page to filter via item number/s. For example below. The CDM items 721, 723 and 732 have been selected. So here I can see clearly how many services have been billed for these items for each practitioner. This provides a visual where some practitioners are billing more than others for the selected date range- In particular for CDM do I have a Doctor that does not seem be billing many review items (732) and may need some nursing support with this? I could then use my Item optimisation page for that Doctor and find his possible service opportunities for item 732.

