
This metric will show you the information you need to understand how utilised your practice space is by Practitioners. For example, you may be considering costs for renovations to expand or even to relocate, thinking you do not have adequate space in your current setup. However, looking into these metrics may give you some insight into how much time your Practitioners spend in each of these revenue-generating assets.
Note: You must complete both your Open Hours and Rooms sections in Settings to allow you to view key utilisation data in this metric.
Please visit Completing Cubiko Settings for information on setting up and allocating your rooms
To navigate to this metric, go to Clinic Insights > Future clinic metrics > Room utilisation
The sections included in this article relating to Room utilisation are:
Future room utilisation
Room Utilisation' is calculated as the amount of 'Session Time (Minutes)' divided by 'Opening Time (minutes)', This figure shows the proportion of available time that has been opened in the diary in your PMS for each room in the practice for the selected timeframe.
The default date range is the next seven days, but you can use the date range filter to look further ahead. The room allocation is based on the information you provide under practice preferences.

TOP TIP! To better understand how Cubiko defines time for the utilisation metrics, see our Cubiko time definitions for utilisation knowledge base article.
Session hour includes the time opened up in your appointment book (either via the session setup screen, an appointment added into non-session time, or right-click make available). It excludes practice closures and days away, and right-click is made unavailable.
Future utilisation by room
This figure shows the proportion of available time (from opened hours and available session time) that has been booked for each room in the practice for the selected timeframe. The default date range is the next seven days, but you can use the date range filter to look further ahead.
Rooms will only be made available for bookings on weekends if they have been marked to be included in weekend calculations in Settings.

TOP TIP! Use the filters to filter by Role to view your room utilisation data by Nurses, Doctors or Allied Health. If you have a lot of Allied Health renting rooms in your practice you can see in this metric how much they are utilising this space and when! Pairing this measurement with any of the billing metrics will also give you greater insight into what each room is generating for your clinic, and any rooms that could help bolster billings by engaging additional practitioners.

Daily room utilisation heatmap
This metric shows session time divided by the available time (from opened hours and available session time) for each room in the practice for each day over the selected timeframe.
Rooms will only be made available for these metrics on weekends if they have been marked to be included in weekend calculations in Settings.
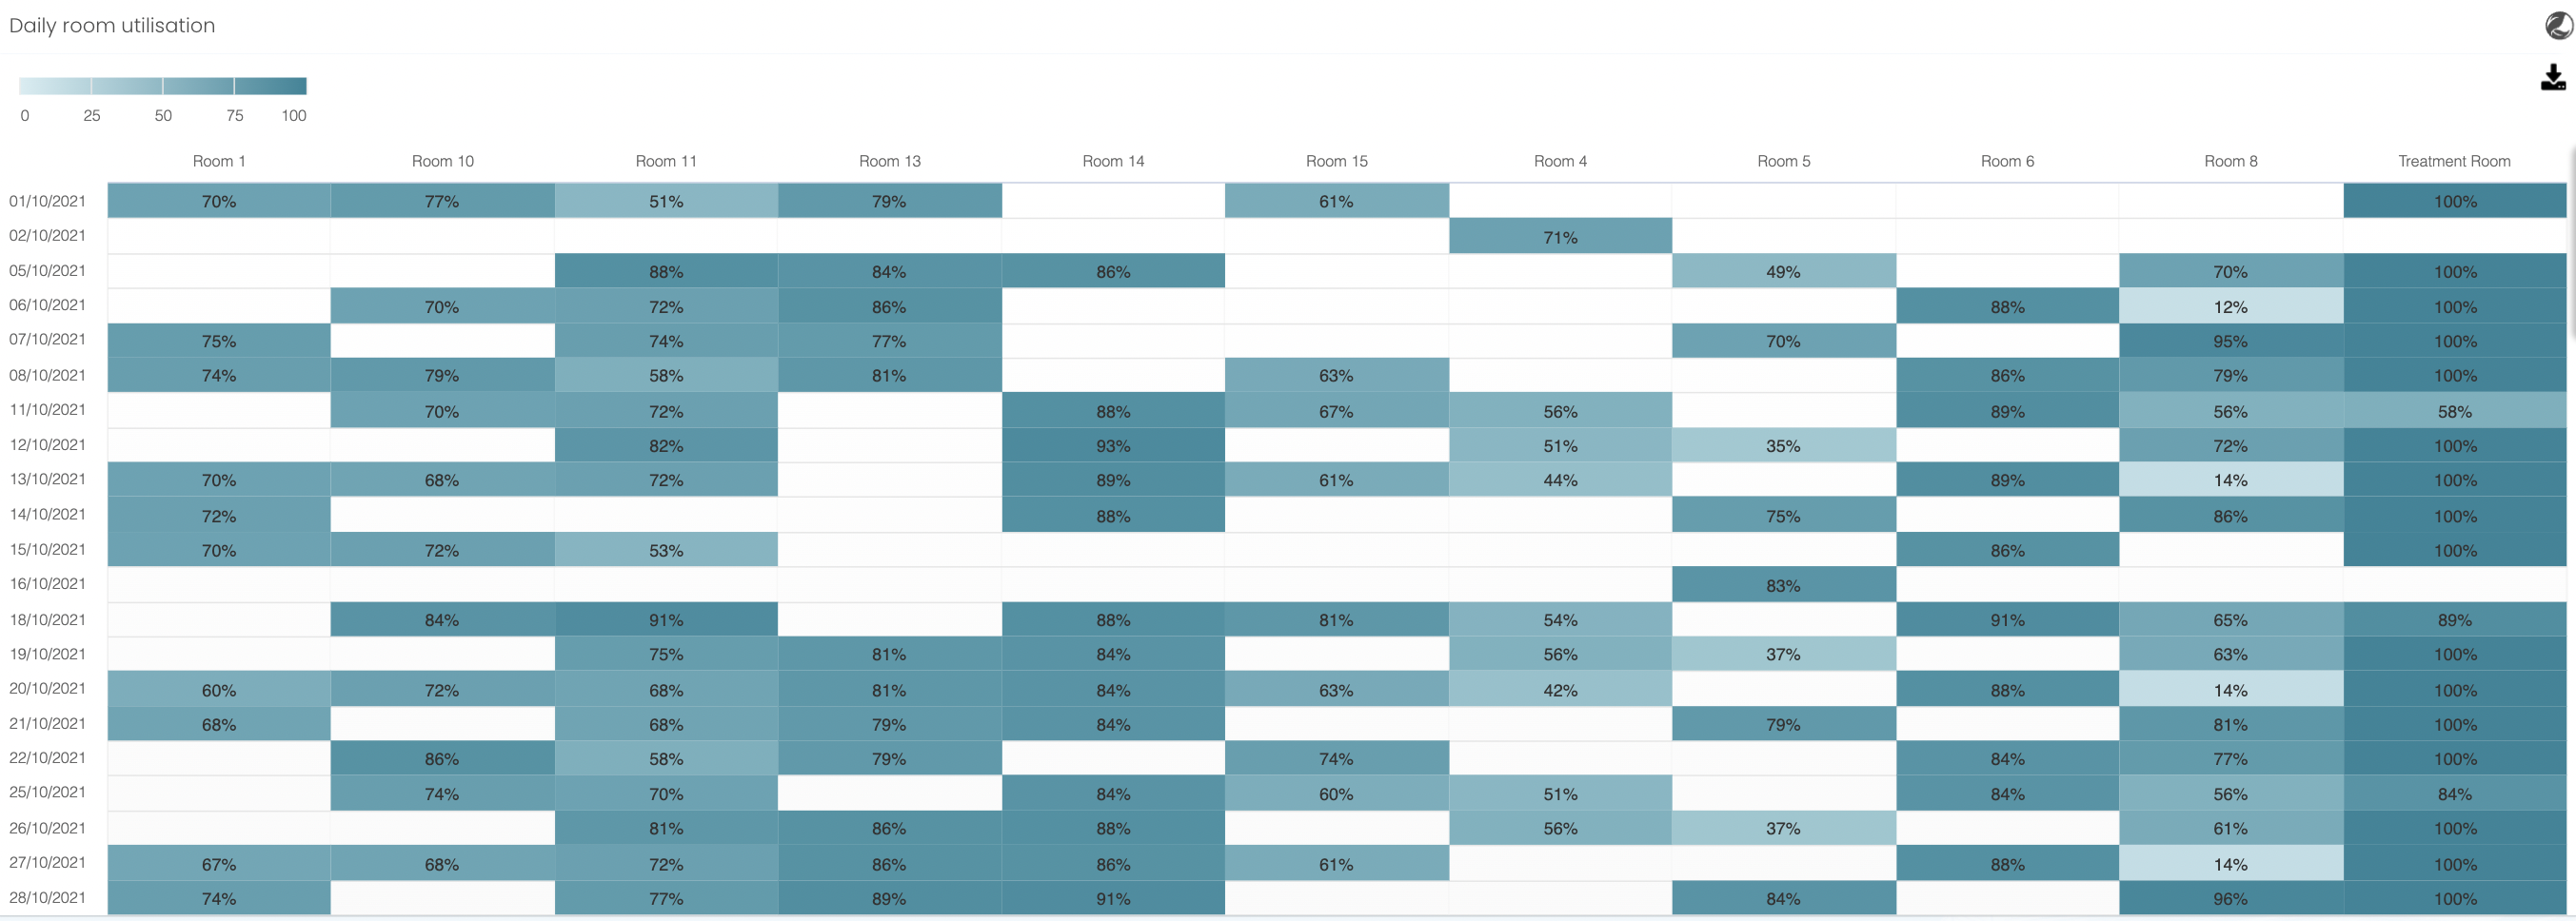
TOP TIP! Use this heat map to easily view days that are under-utilised - this appears as blank white space throughout the heat map. This can be essential in assisting you when rostering Doctors and Allied Health. Reviewing which of your rooms are relatively under-utilised could also provide you with an opportunity to increase income for the business either through an irregular room rental, or additional service fee-paying Practitioners.
Future room utilisation by hour
This metric will allow you to see the room, date, time, session time (as minutes), Consultation time, opening time (as minutes), and the percentage of room utilisation of each room, for that time period.

TOP TIP! Use the filters to see more specific data on date ranges, rooms, days, roles, or practitioners, to be able to make the most informed decisions on where there may be an opportunity to better utilise a room.

Additional Resources:
- See our Completing Cubiko Settings knowledge base article for information on how to set your opening hours and room set-up.
- See our Cubiko time definitions for utilisation knowledge base article for further information on how Cubiko defines time for the utilisation metrics.