
This metric shows the top 10 most billed item numbers this month (to date) compared to the top 10 most billed item numbers for the same time last month. You can also click through for a more detailed breakdown of your Level A/B/C/D, GPMP, and TCA items, comparing billings month to date vs the same time in the previous months for the current calendar year.
You can navigate to this metric by going to Clinic Optimisation > Item optimisation > Top 10 MBS items (month vs month)

The item numbers billed are listed at the bottom of the graph, allowing you to track their use. If you hover your mouse over the metrics within the graph you will see the number of services for that item that were billed for the current month (to date) and the previous month for the same time. It will also show any change between these figures as a %.
TOP TIP! The breakdown of item numbers by level and type will help you understand your Practitioners use of billing numbers. You can view these billings on a monthly basis trend over the calendar year. If you are seeking a way to re-engage with your patients, you can also check out our metric: Frequent patients with no future appointment booked.
The sections included in this article relating to the Top 10 MBS items metric are:
- Top 10 MBS Items this month
-
Items billed this month vs this time last month
- Top 10 MBS items this month vs this time last month
- Level A
- Level B
- Level C
- Level D
- GPMP
- TCA
- Services by month
Top 10 MBS items this month
This pie chart shows the top 10 most billed item numbers for the current month. You can hover over the pie chart to see what percentage each item number billed makes up of the total item numbers billed and how many services that equates to.

Items billed this month vs this time last month
This figure shows the total number of items billed this month (to date) and the total number of items billed for the same time last month. It also includes a percentage increase or decrease based on these figures.

Top 10 MBS items this month vs this time last month
This metric shows the top 10 most billed item numbers this month (to date) compared to the top 10 most billed item numbers for the same time last month. If you hover your mouse over the metrics within the graph you will see the number of services for that item that were billed for the current month (to date) and the previous month for the same time. It will also show any change between these figures as a %.
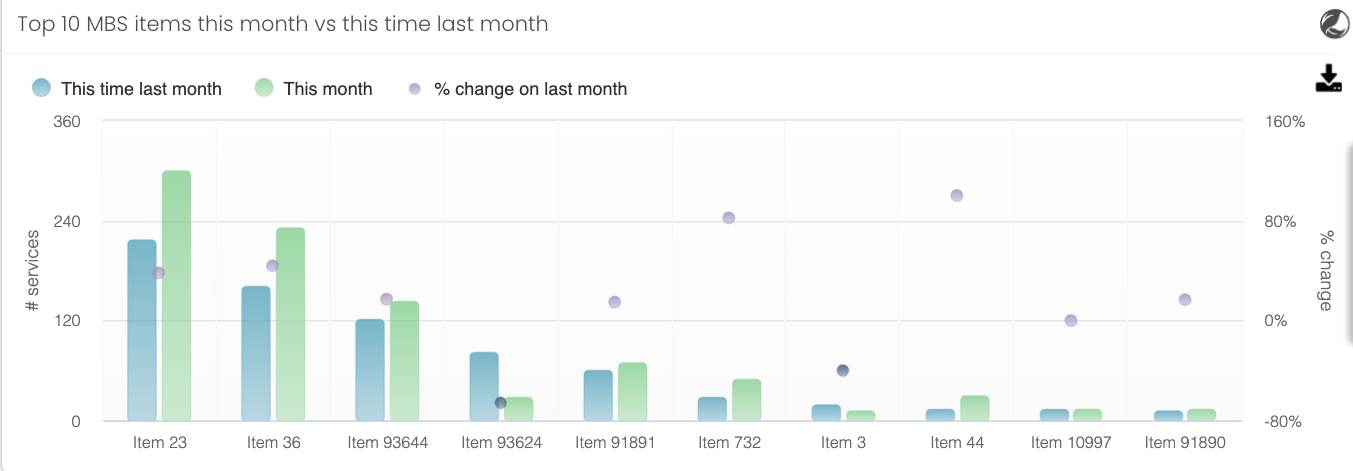
TOP TIP! You may use this tool as a guide to show you where you are potentially missing opportunities, e.g. where you billed an item number last month heavily but are not utilising this item to the same level this month. This may inspire you to look deeper into who is attending your practice and why there is a drop-off or increase in certain item numbers e.g. health assessments or consultation items.
Level A
This metric compares the number of Level A items billed since the beginning of the current calendar year. It includes a breakdown of these consults across face-to-face, telehealth and telephone consultations. You can hover over the bar graph to see the total item numbers for each month.

TOP TIP! You could use this tool to track the performance of telehealth items vs face to face items in your practice, for example, if you are aiming to reduce telehealth, this tool lets you see how well your practice is managing to do that.
Level B
This metric compares the number of Level B items billed since the beginning of the current calendar year. It includes a breakdown of these consults across face to face, telehealth and telephone consults. You can hover over the bar graph to see the total item numbers for each month. 
Level C
This metric compares the number of Level C items billed since the beginning of the current calendar year. It includes a breakdown of these consults across face to face, telehealth and telephone consults. You can hover over the bar graph to see the total item numbers for each month. 
Level D
This metric compares the number of Level D items billed since the beginning of the current calendar year. It includes a breakdown of these consults across face to face, telehealth and telephone consults. You can hover over the bar graph to see the total item numbers for each month.

GPMP
This metric compares the number of GP Management Plans billed since the beginning of the current calendar year. It includes a breakdown of these consults across face to face, telehealth and telephone consults. You can hover over the bar graph to see the total item numbers for each month. 
TOP TIP! Use the GPMP and TCA metrics on this page to visualise how much Chronic Disease Management your practice is completing and whether you need to recall eligible patients for GPMP and TCA appointments.
TCA
This metric compares the number of Team Care Arrangements billed since the beginning of the curent calendar year. It includes a breakdown of these consults across face to face, telehealth and telephone consults. You can hover over the bar graph to see the total item numbers for each month.

Services by month
This metric lists all services by item number, showing the number of times each item has been billed for this month, last month and 2 months ago. You can download this table directly as a .CSV file to open in Excel using the download arrow on the right-hand side of the metric. 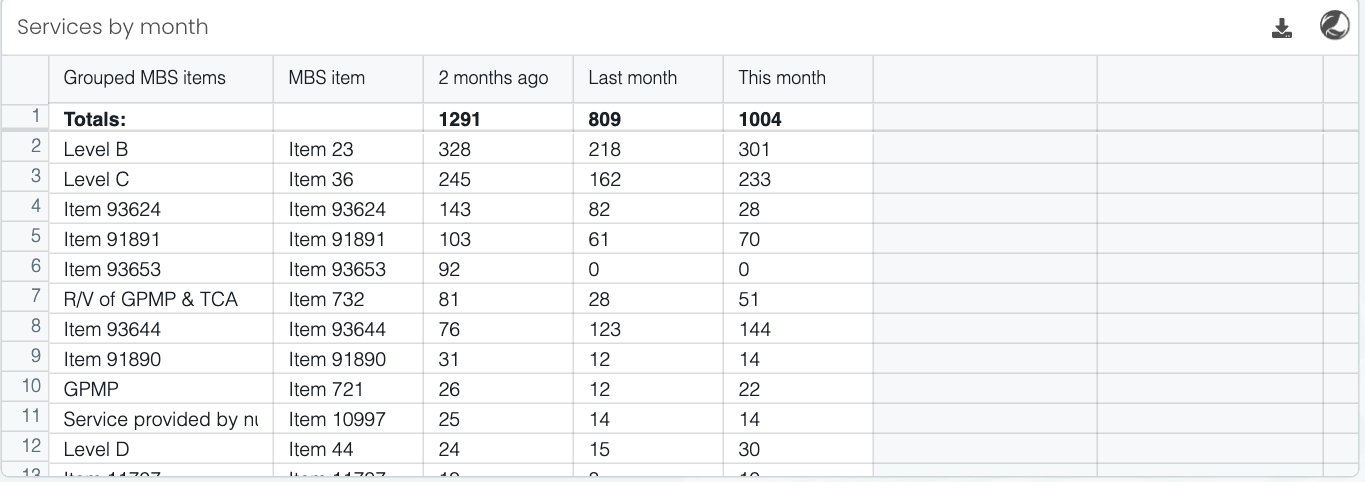
TOP TIP! This metric will allow you to sort by the column ‘Group MBS items’ so you can see all Level A, B and C items billed over the last three months, to compare how you are billing based on your most common item numbers.