
This metric can be found under Summary > Summary of billings at the Practice > Gross billings vs amount due to Practice
To ensure this metric is accurate for your practice, you will need to provide us with the information that determines the calculation first. To do this, head to Cubiko Settings and fill in the section for each billing Practitioner under Users using the Percentage due to Practice column.
Percentage due to Practice in general is asking what percentage of gross billings does this User pay the practice as a service fee? If you don’t want to tell us this information, that’s ok, but this metric will remain blank with no information about the dollar amount that your practice will retain from the total gross billings.

The sections included in this article relating to Practice billings showing gross vs. practice share are:
Gross billings vs amount due to Practice
This figure represents the gross billings for the selected time period and the practice share of those billings based on the percentage agreements for the included service providers.

TOP TIP! Use the filters within the metric to filter down via item number to use this metric to ensure the practice share of billings is covering the expenses for certain consumable item numbers billed by your Practitioners that the practice incurs a cost, such as consumable costs for pregnancy tests, ECG's and spirometry.
These item numbers will be billed under your Practitioner and the practice will receive a share (depending on the practice service fee to be applied). Review each of these items to ensure the practice is charging enough to cover the expense.
For example:
In the below example, we are viewing one month of billings for ECG item number 11707.

The total billed under the item was $328. If we bill $21.86 to our patients for an ECG this would mean there are 15 services. The practice share of those 15 services was $92.00 averaging around $6.10 retained by the practice for each ECG performed.
Does this amount cover the consumables for ECGs and nurse time?
Practitioner billings
This figure represents the gross billings by practitioner broken down by Doctor share and Practice share for the selected time period. Detail of the gross billings for the previous year is also included by the practitioner if it is available.

If you have new Practitioners in this graph and also Practitioners who no longer work at the practice, it will also allow you to benchmark using the ‘Gross billings last year’ marker, to understand if replacement Practitioners are performing at the same, increased or decreased capacity based on the history of the practice billings. New Practitioners will show a zero value for any date range they have not previously worked.
TOP TIP! Hover your mouse over the areas of the graph you want more detail about, to see the dollar values of these splits.

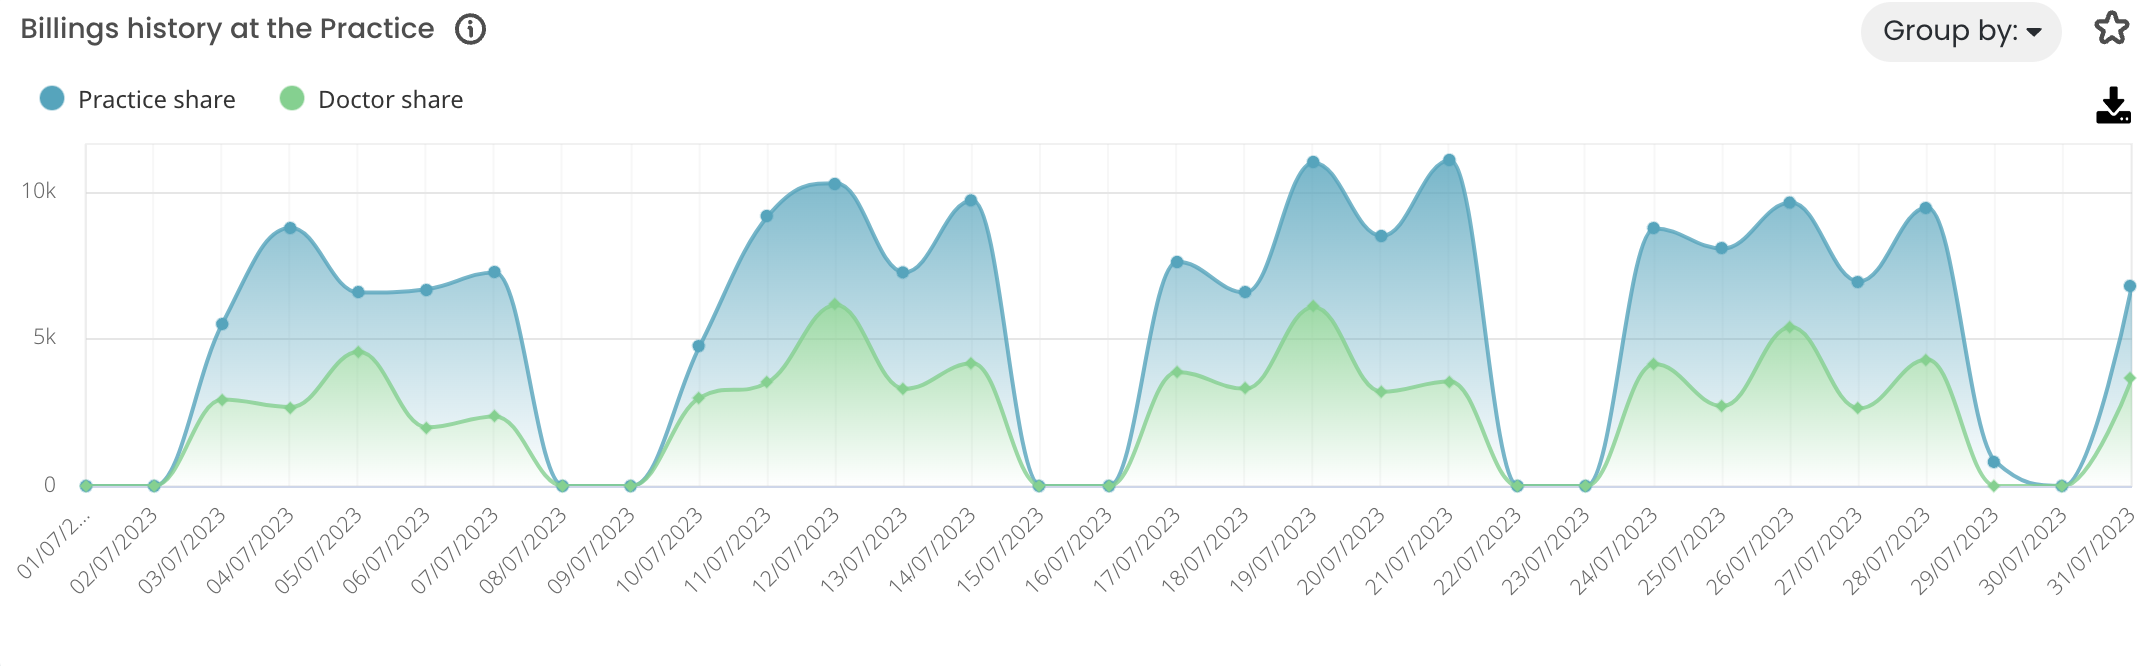
Billings history at the Practice
This figure represents the billings history at the Practice based on gross billings for the selected time period. The graph shows the Doctor's share and Practice share over this time period. You can view the data in the graph by day, week or month by using the Group by drop-down filter in the top right-hand corner of the graph.
Gross billings vs. the same time last year
This figure represents the gross billings at the Practice for this year and last year over the selected time period. You can view the data in the graph by day, week or month by using the Group by drop-down filter in the top right-hand corner of the graph.
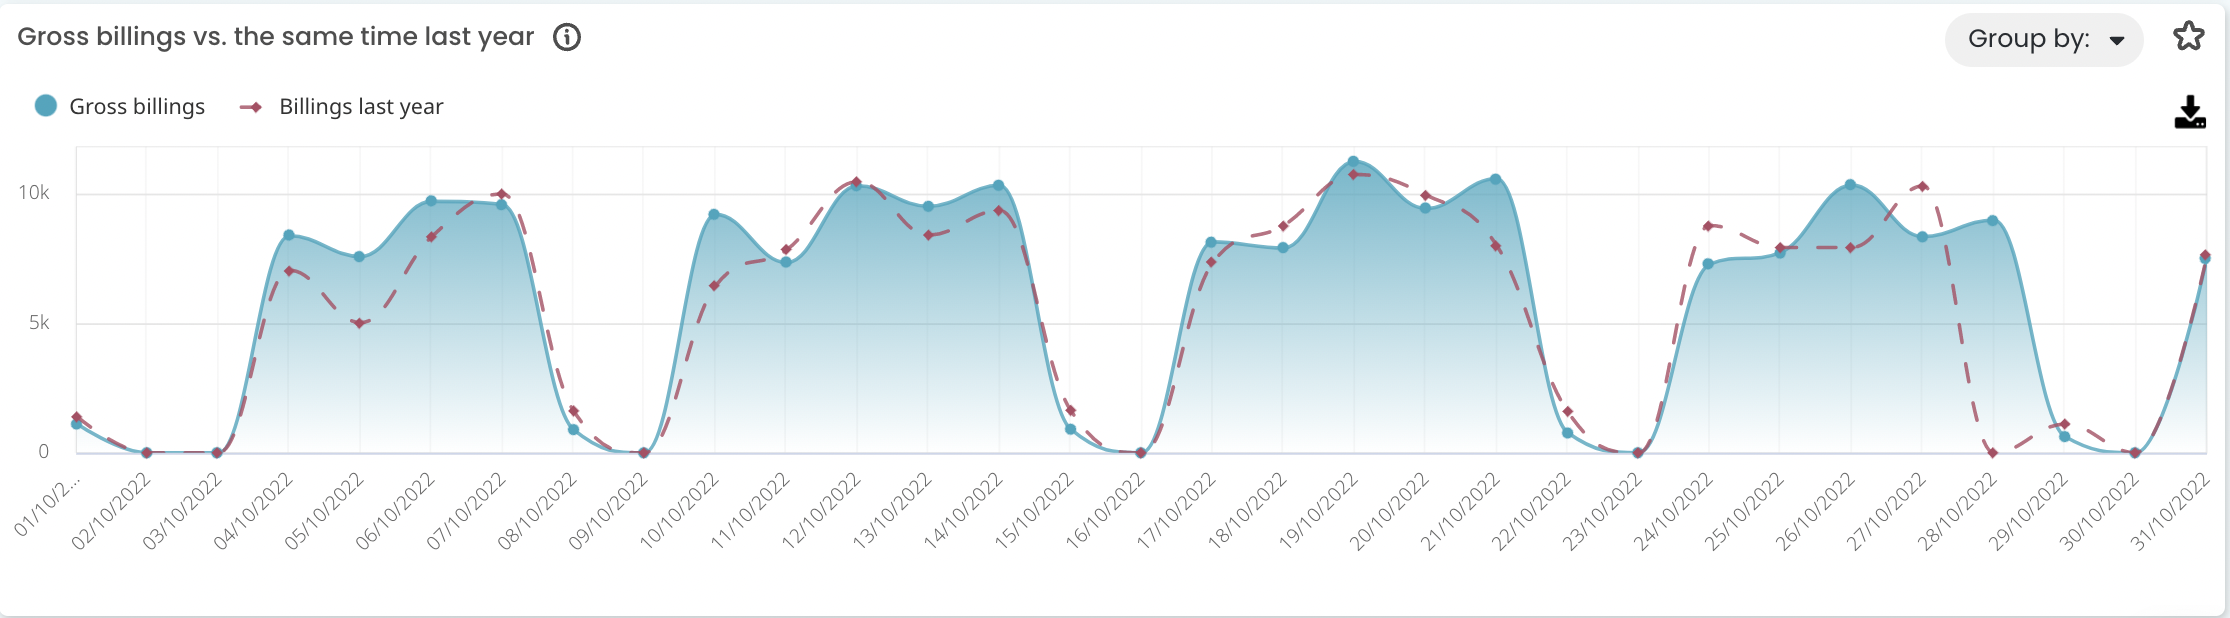
The higher the gross billings, the more likely you are to be covering your operational costs, the goal then is to deliver profit. You should have a good grasp on your monthly operating costs, so you can use this metric in tandem with metrics like the Practice Forecasting cabinet to understand your practice needs based on current and predicted performance goals.