Busiest booking time
Find out when appointments are being made for both your online and in-practice bookings
Busiest booking time contains metrics to show you when appointments are being made at your practice based on the number of bookings taken during that timeframe broken down by day and hour.
To navigate to this metric, go to Clinic Insights > Past clinic metrics > Diaries tab > Busiest booking time.

The sections included in this article relating to the Busiest booking time are:
- Busiest booking time
- Total bookings
- Average reception bookings by weekday
- Average online bookings by weekday
- Reception bookings by date
- Online bookings by date
Busiest booking time
This figure shows the busiest time the appointments were made over the selected timeframe.

TOP TIP! This is the time of day when the most number of appointments are being made in your practice. You can see this broken further on the page by those appointments made by your reception team and those made by your online booking system.
Total bookings
This figure shows the total bookings made per day for the selected timeframe. You can view which days have the highest number of bookings being made by your reception team and those via online bookings.

NOTE: This metric is looking at the date the appointments were created, not the appointment date. If you would like to see the Busiest practice time, check out our Knowledge Base article here.
Average reception bookings by weekday
This heatmap shows the average number of appointments made per hour and per day by reception for the timeframe selected. The darker the square the more appointments that were made.
This metric can help you to allocate reception staff on the phone at the time when it is the most busiest.

You can also filter this heatmap using the Select Booker filter, to see when an individual person makes the most appointments across the day and week.
TOP TIP! Use this heatmap to gain clarity around when your reception team is taking bookings.
A practice may only have 1 doctor working on a Monday morning, however, the receptionist may be fielding calls and making a large number of appointment bookings at this time, enough to warrant an extra team member to assist.
This metric provides insight into where you may need to roster differently from conventional doctor/staff ratios.
Average online bookings by weekday
This heatmap shows the average number of appointments made per hour and per day by patients using your online booking system. The darker the square the more appointments that were made.
This metric can help you visualise when your patients are using your online booking system. Is it when reception is too busy to answer their call? Or is it after-hours when the practice is closed?

TOP TIP! Review this heatmap to see when your online bookings are being made. Are your patients aware they can make bookings online at any time of the day or night?
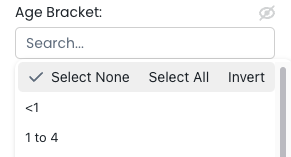
Use the "Age bracket" filter to filter your data into age brackets. Here you can select one bracket or multiple. This is a great way to see the demographic using your online appointments:

Reception bookings by date
This heatmap shows the number of appointments made per hour and by date by your reception team. The darker the square the more appointments that were made.

NOTE: If you move or adjust a number of appointments in one sitting, this will impact the number of bookings made at that time. For example, if you reschedule an entire vaccination clinic at 9am, this will list all of those rescheduled appointments as bookings for that time.
This allows you to see the amount of work incurred to reschedule those appointments.
Online bookings by date
This heatmap shows the number of appointments made per hour and by date by your online booking system. The darker the square the more appointments that were made.

TOP TIP! Review this heatmap to see when the most popular time for online bookings occurs, is there a reason why?
