
This page brings together everything you need to know about how appointments are being booked at your practice: who's taking the bookings, when your busiest times are, and whether patients are booking in person or online.
To navigate here: Home > Clinic Insights > Past clinic metrics > Diaries > Busiest Booking Time > Appointment Bookings
Jump to:
- Total bookings by weekday
- Busiest booking time
- Bookings by booker
- Average reception and online bookings by weekday
- Reception and online bookings by date
- Trend of appointment bookings by booking method
- Using the charts and tables
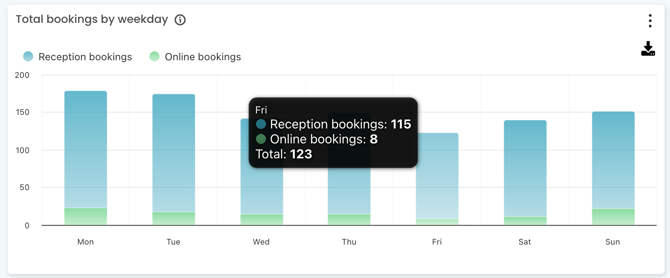
Total bookings by weekday
What it covers: the total number of appointments booked per day for your selected timeframe, split by reception and online bookings.
How it helps the team: spot which days of the week bring in the most bookings, and how much of that load is landing on reception versus your online booking system.
NOTE: This metric looks at the date the booking was made, not the date of the appointment itself or how many patients are physically attending on any given day.
If you're after appointment attendance volume by day, check out our Busiest practice time knowledge base article.
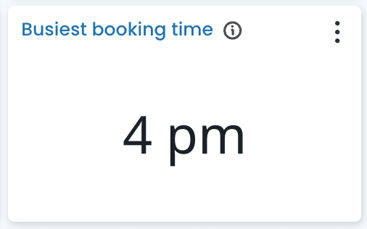
Busiest booking time
What it covers: the busiest time of day that the appointments were made over the selected timeframe.
How it helps the team: use this alongside the reception and online breakdowns further down the page to see exactly when your phones are running hot, and when patients are booking online instead.
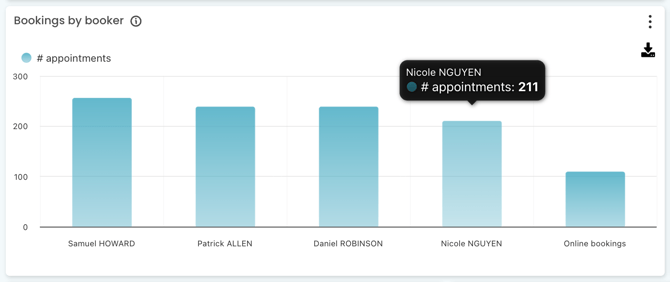
Bookings by booker
What it covers: the number of appointments booked by each team member with PMS access, plus a total for online bookings.
How it helps the team: get a clear read on who's taking the most bookings, and how online bookings compare to reception overall.
TOP TIP! It's a great way to see how many patients rebook with the reception team, and whether your online bookings are tracking where you'd expect. Low numbers there might mean it's time for a reminder campaign about booking online.
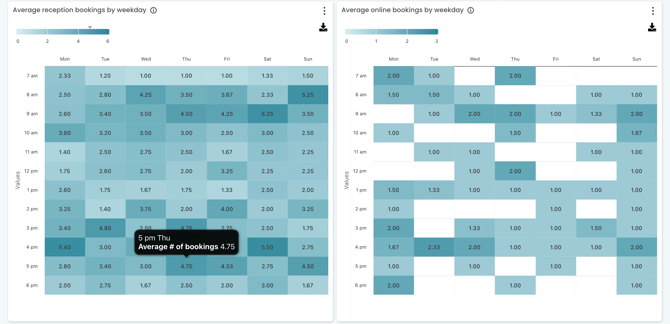
Average bookings by weekday
What it covers: two heat maps showing the average number of appointments made per hour, per day, by reception and by your online booking system. The darker the square, the busier that hour.
How it helps the team: these metrics help with rostering and resource allocation.
- Average reception bookings - use this to work out when reception needs extra help on the phone. A quiet Monday morning for GPs can still mean a receptionist is flat out fielding calls. Knowing the hottest times of the day that your admin team are taking bookings means you can better identify where to allocate staff (such as casuals start/finish times) and breaks such as morning tea and lunch.
- Average online bookings - use this to understand when patients are booking online. Is it after-hours when the practice is closed, or during the day when reception might be busy?
Bookings by date
What it covers: two heat maps showing the number of appointments made per hour, by date, for reception and online bookings. The darker the square, the busier that hour.
How it helps the team: these give you the day-by-day detail behind the averages above.
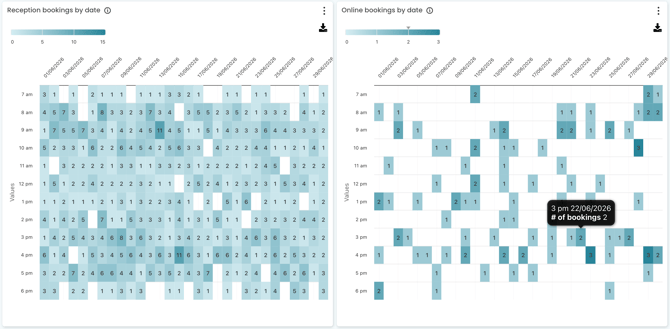
NOTE: If you reschedule a batch of appointments in one sitting (like an entire vaccination clinic), those will all show as bookings made at that time. It's a handy way to see the workload involved in rescheduling.
Trend of appointment bookings by booking method
What it covers: a trend graph showing appointment bookings over time, split between conventional (reception) and online bookings.
How it helps the team: group by day, week or month using the table filter on the right to spot patterns over a longer period, and track whether online bookings are growing.
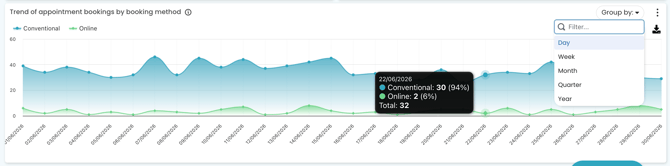
TOP TIP! Use the table filter on the right to group by a different time period - especially helpful when looking at data with a wide date range such as a full 12 months or longer.
Using the charts and tables
You can filter this whole page using:
- Date range - the time period you want to look back on, e.g. last week
- Select Booker - view individual or multiple team members
- Select booking method - view bookings made in person or via phone/online
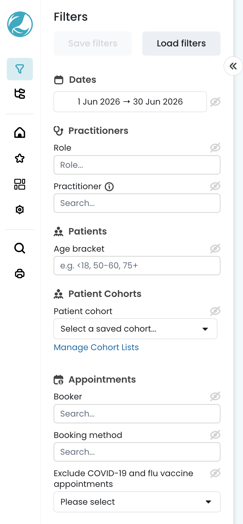
For more on how filters work across Cubiko, check out our Filters knowledge base article.