
We have built this cabinet to let you quickly calculate a percentage (%) of a Practitioner's billings and then easily show their key billing and operational metrics on a single page as a generated personalised report.
You can use the filters at the top of the page to give yourself and your Practitioners insights into specific date ranges, or the impact different service fees maybe have on your practice.
We hope this helps in your Practitioner distribution process, and also in helping share insights with them.
This dashboard will be kept in Preview to give us time to learn from you what works best. Please provide feedback to us by email at support@cubiko.com.au to help us better understand how you might put it to use at your practice!
It is now available for you to access within Cubiko’s Preview tab.
You can find this metric under Financial Insights > Billings calculator.

The sections included in this article relating to Billings calculator are:
Filter selection
The first step to using the Billings calculator is to use the filters to select the report date range and biller to generate their personalised billings report.
Use the reset button to restore your selection to none to generate a new report for a new biller.
![]()
You can manually enter the Percentage due to practice in the field provided, otherwise, it will default to any Percentage due to practice that you have entered in our Settings for that biller.

NOTE: Before running this report, please ensure your Date of data extract is showing TODAY'S DATE at the top of the page. This will ensure your Cubiko data is up to date.

Report selection
Once you have selected a date range and biller, you can view the personalised billings report by three different options, depending on which option works best for your practice. These are:
- By paid date
- By service created date
- By service date

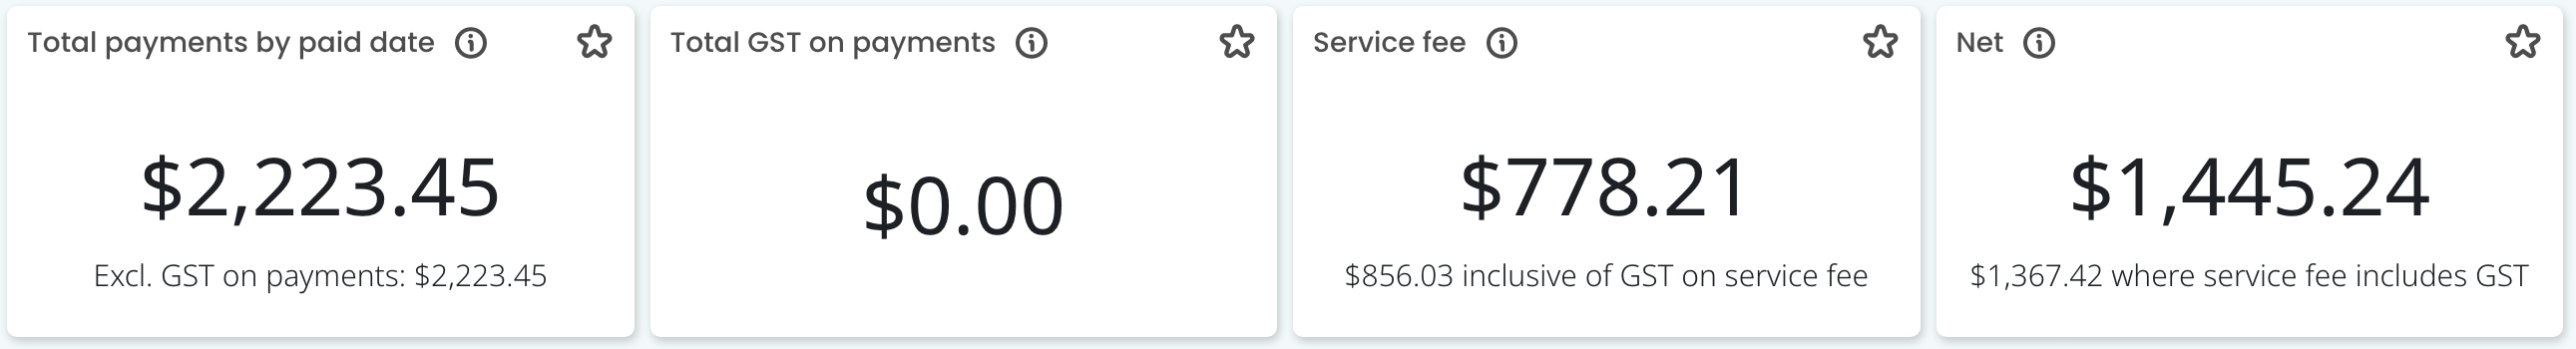
By paid date
These metrics represent the total paid billings (inclusive of any applicable GST) in the selected period of time, based on the date the payment was received in your Practice Management Software (PMS).
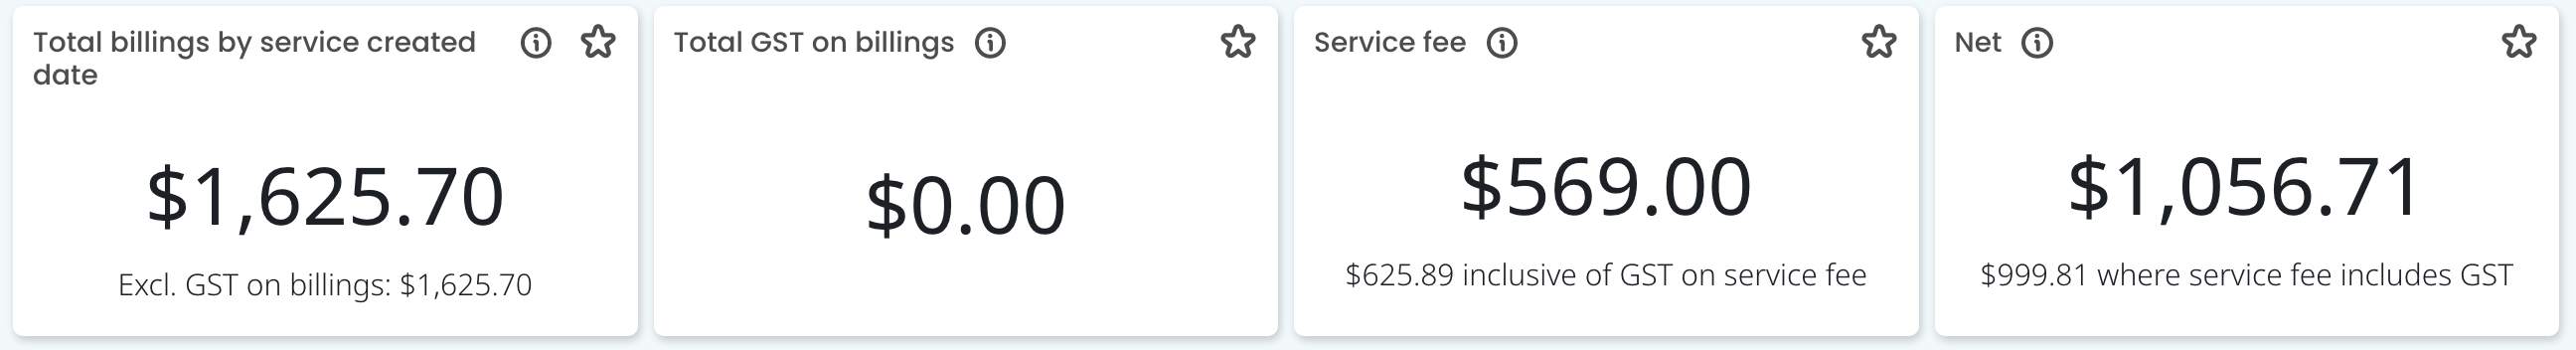
By service created date
These metrics represent the total billings (inclusive of any applicable GST) in the selected period of time, based on the service created date in your Practice Management Software (PMS).
By service date
These metrics represent the total billings (inclusive of any applicable GST) in the selected period of time, based on the service date in your Practice Management Software (PMS).

NOTE: The Total GST on payments or billings metric is representing the GST billed through your Practice Management Software (PMS).

Service fee
This figure represents the service fee on total payments or billings (depending on your report selection), exclusive of any applicable GST.
The Service fee is calculated by removing any GST billed in your PMS and then multiplying that figure by the service fee percentage.
This is based on the service fee percentage entered in Cubiko Settings, and can be adjusted in the filter selection at the top of the page.

The figure at the bottom of the tile shows the calculated service fee inclusive of GST (10%) applied to the service fee total.
TOP TIP! This is the amount that the Practice will receive from the gross payments/billings for the selected time period.
Net
This figure represents the net, which is calculated as total payments or billings (depending on your report selection), inclusive of GST less the service fee.
The Net figure is calculated by taking the total payments/billings figure and subtracting the Service fee calculated.
This is based on the service fee percentage entered in Cubiko Settings, and can be adjusted in the filter selection at the top of the page.

The figure at the bottom of the tile shows the calculated net figure inclusive of GST (10%) applied to the service fee total.
TOP TIP! This is the amount that the Practitioner retains from the gross payments/billings for the selected time period.
EXAMPLE BILLINGS CALCULATION
Practitioner gross payments = $1,030
Total GST on payments = $30
Service fee = 35%
$1,000 x 35% = $350 service fee
GST (10%) on the service fee is $35
Therefore:
Total service fee (incl GST) = $385 (PAYMENT TO PRACTICE)
Net (incl GST on payments) = $745 (PRACTITIONER RETAINS)
Key statistics
Billings and Payments
Review three key metrics relating to payer breakdown, proportion comparison of payments and billings, and bulk billing rate for the biller and date range selected.
Depending on which report tab you have chosen you will see the below metrics.
Total Payments by Payer
This figure represents the proportion of total paid billings (by the payment date) attributed to each type of Payer in the selected period of time.

Total Payments
This figure represents the total paid billings by payment date and the proportion that the practice receives in the selected period of time.

Bulk billing rate
This figure represents the proportion of total billings that have been bulk billed for the item numbers that are eligible to be billed to Medicare in the selected period of time.

Total billings by Payer
This figure represents the proportion of total billings (either by the date the service was created or the date of service depending on the report tab selected) attributed to each type of Payer in the selected period of time.

Total billings
This figure represents the total billings by either the date the service was created or the date of service depending on the report tab selected, and the proportion that the practice receives in the selected period of time.

Averages
Review three key metrics relating to average billings per hour and appointment for the biller and date range selected.
Total billings per session hour (by service date)
This figure represents the average billings and proportion the practice receives per session hour by service date in the selected period of time.
Session hour includes the time opened up in your diary (either via the session setup screen or right-click - make available).

Total billings per appointment (by service date)
This figure represents the average billings and proportion the practice receives per patient by service date in the selected period of time.

Appointments per session hour (by service date)
This figure represents how many patients the Practitioner consulted over the average session hour in the selected period of time. Session hour includes the time opened up in your diary (either via the sessions setup screen or right-click - make available).

Operations
Review two key metrics relating to CDM billing percentage and outstanding debt for the biller and date range selected.
CDM % of total billings
This figure represents the Practitioner’s chronic disease management (CDM) payments/billings as a percentage of the Practitioner’s total payments/billings (inclusive of GST) based on either payment date, service created date or service date, depending on which report tab selected.

Debt (as of last load)
This figure represents the remaining unpaid gross billings/invoices and shows the proportion the practice will receive (as of the latest data extraction).

Payments reports
View two key reports regarding payments or billings for the date range selected. One report is grouped by MBS category and if you click on the 'expand for details' accordion heading, you can view a detailed list of paid invoices or billed invoices, depending on the report tab selected.
Payments by MBS header
This list shows the details of paid billings by MBS category and payment date in the selected period of time. The service fee % per payment can be adjusted at the top of the page for all figures.
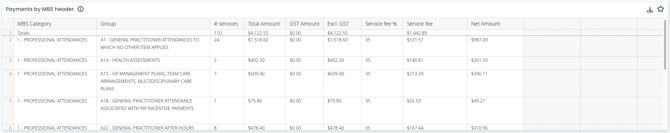
TOP TIP! By downloading and opening this report as a .csv file in Excel, you can adjust the calculations for Service Fee and Net by amending the % for an item number or MBS category, if you have any that may be different from the standard rate.
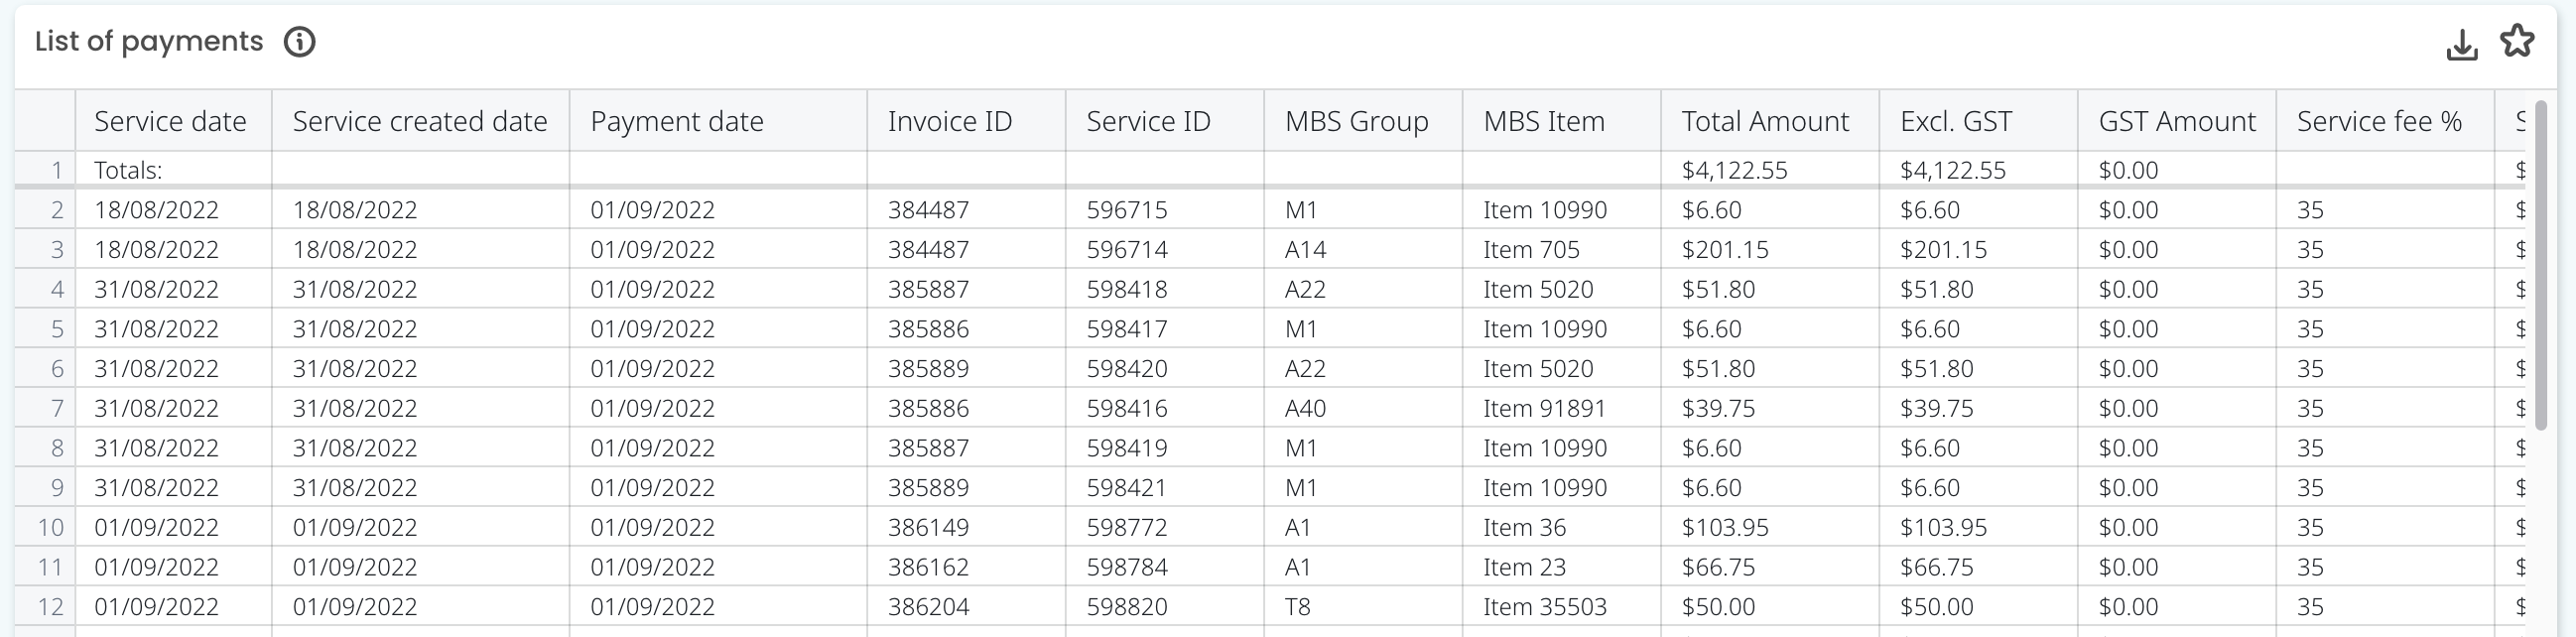
List of payments
This list shows the details of paid invoices by payment date in the selected period of time.
You can sort this table by invoice ID, service ID, MBS Group or MBS Item to see a specific grouping of invoices.
Billings by MBS header
This list shows the details of total billings by MBS category and either the date the service was created or the date the service occurred in the selected period of time, depending on the report tab selected. The service fee % per billing can be adjusted at the top of the page for all figures.

List of billings
This list shows the details of billings invoices by either the date the service was created or the date the service occurred in the selected period of time, depending on the report tab selected.
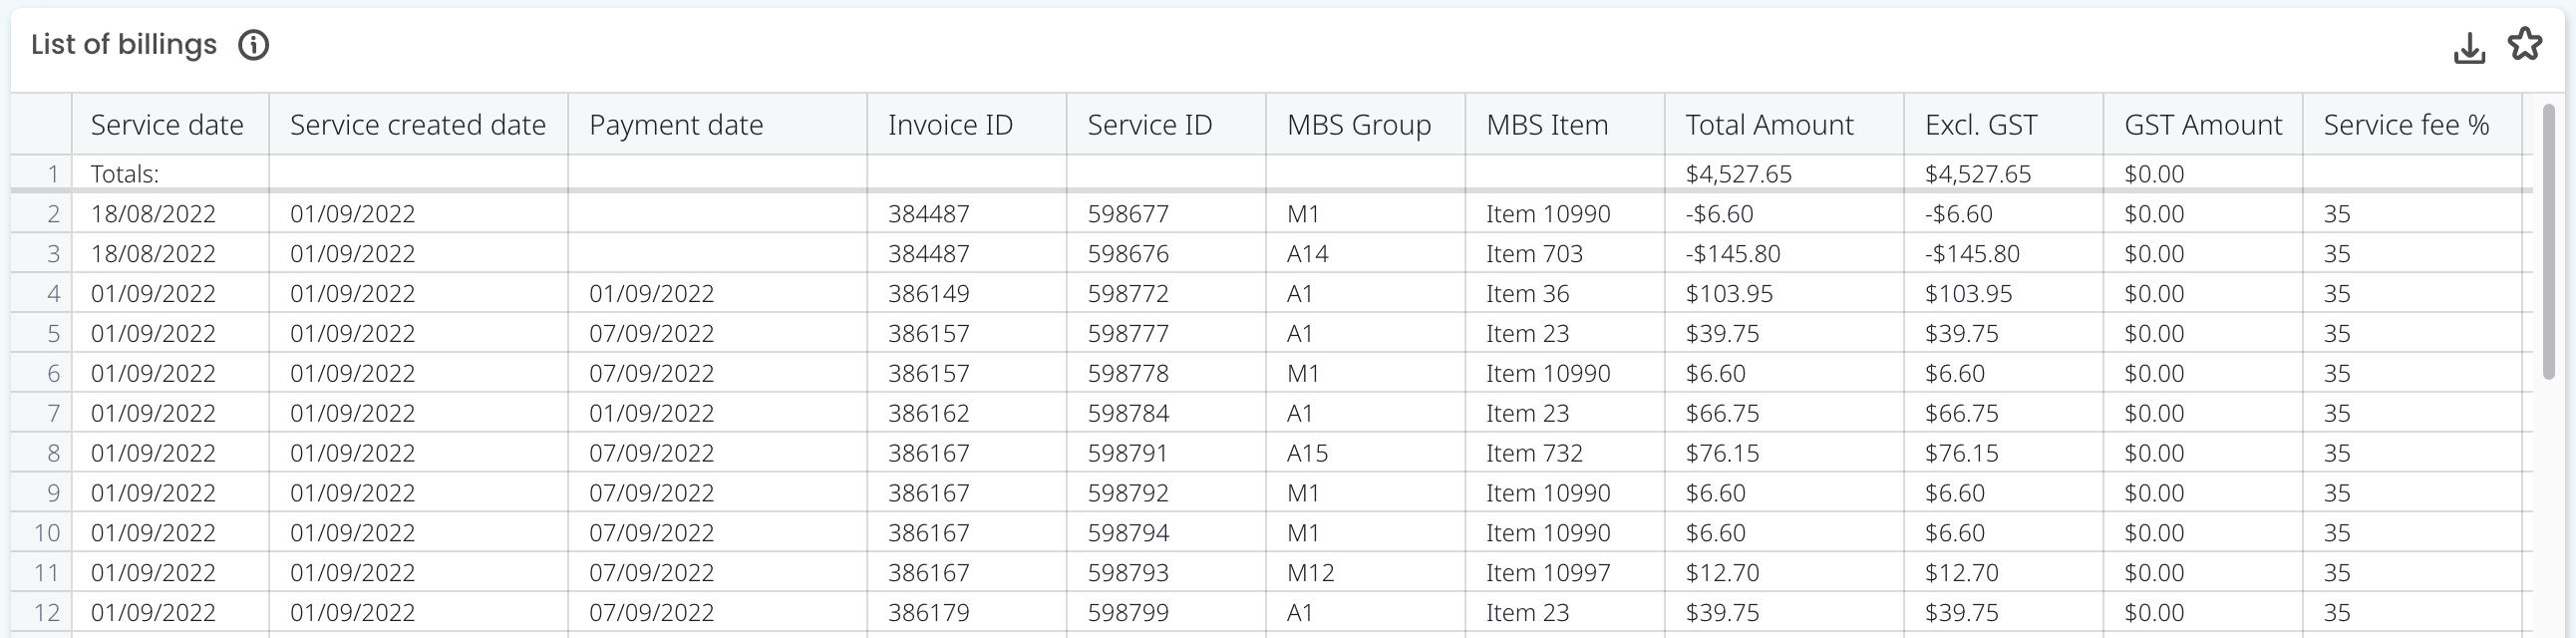
NOTE: Any negative amounts showing in this list are reversed invoices.
TOP TIP! Review more information about MBS item numbers and MBS Groups at MBS Online.
Cubiko insights
Diaries
Review three key metrics that can have an effect on a Practitioner's billings for the date range selected. Here you can view utilisation trend, unbilled appointments and uncompleted appointments.
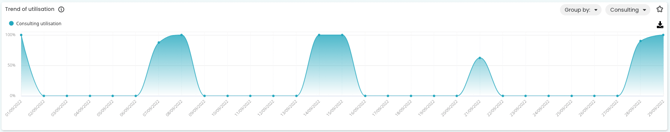
Trend of utilisation
This graph shows either the booking utilisation or consulting utilisation (select in drop-down box) and how this trend has changed over time. Higher numbers indicate that you are more heavily utilised.
You can also group this graph by day, week or month if you are looking at trends over longer date ranges.
List of unbilled appointments
This list shows the details of the unbilled appointments within the selected period of time.
Unbilled appointments are those completed appointments with no matching invoice for that appointment date.
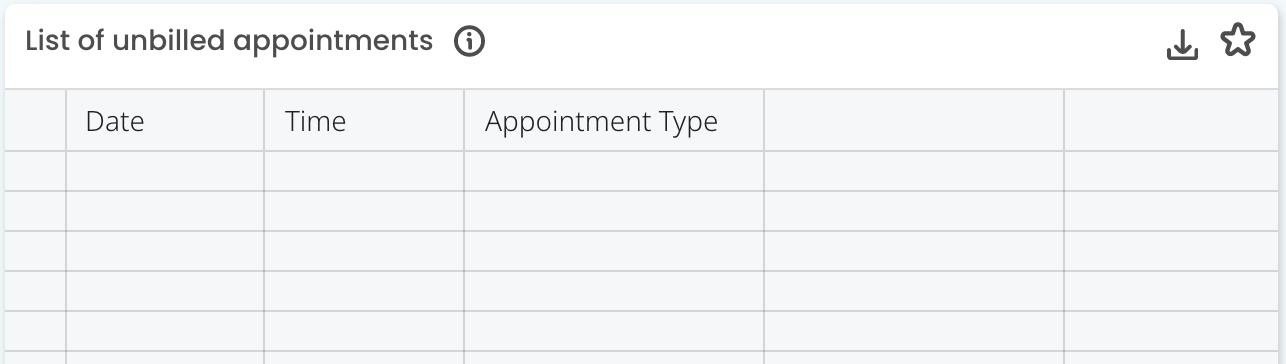
TOP TIP! Ensure your administration team reviews this metric on a weekly basis to reduce the impact of unbilled appointments on your practice cash flow.
Patient uncompleted appointments
This list shows the details of patient appointments that are still at the status of 'Waiting', 'With Doctor' or 'At Billing' in your appointment book for the date range selected.
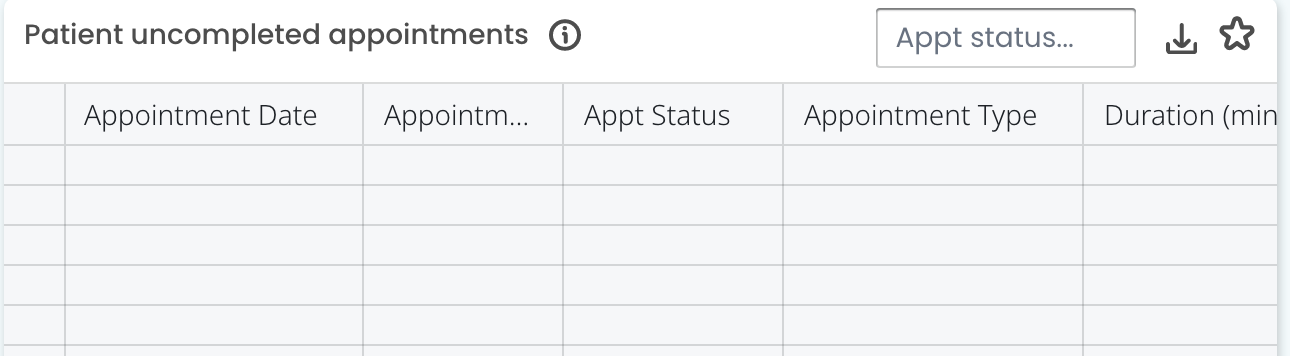
Use the 'Appt status...' filter to filter down to certain appointment status type or sort the list by any of the column headers.
TOP TIP! Ensure your administration team reviews this metric on a weekly basis to reduce the impact of appointments remaining unbilled on your practice cash flow.
Operations
Review two key metrics that can have an effect on a Practitioner's billings for the date range selected. Here you can view a detailed list of debtors and any invoices that have been written off, deleted or cancelled.
List of debtors
This list shows the details of invoices having an unpaid service and which are not billed to Medicare/DVA. To action an item in this list, follow up with the Payer for payment of the account.
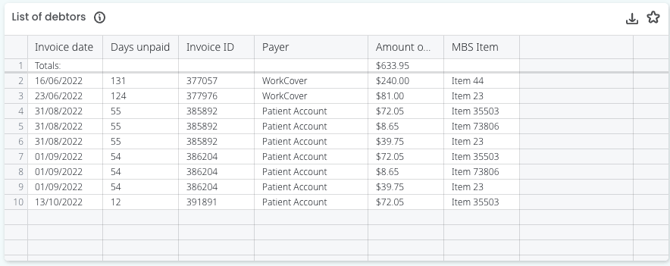
TOP TIP! Review your outstanding debtors list on a monthly to ensure you stay on top of unpaid accounts.
List of written off/deleted/cancelled invoices
This list shows the details of any written-off, deleted or cancelled invoices for the selected date range.
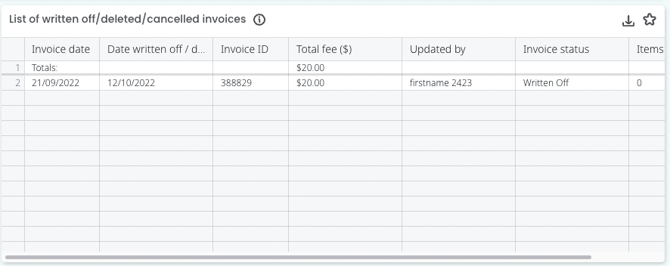
TOP TIP! Use this table to find any patterns of who is writing off, deleting or cancelling invoices. This metric can help prevent fraud as well as find any invoices that should not have been written off, deleted or cancelled.
Integrations
Connect Surgical Partners to Cubiko to get a more detailed look at your practitioners' fees. Get in touch with our friends at Surgical Partners.
