
Using this metric, you can start to understand what type of patient base your Practice is working with. Some practices are designed to capture transient – or walk-by – patients who use your services based on convenience or work proximity. This could be a CBD-based Practice that has a high turnover of patients.
You can identify from this information that you may need to increase patient average visits in order to keep the practice going strong.
To navigate to this metric, go to Clinic insights > Past clinic metrics > Billings tab > Average Billings per patient

This figure represents the average amount billed (inclusive of GST) to each individual patient for the selected time period.
NOTE: This will include patients who may have had a billing without attending the practice (for example if the practitioner has provided a script repeat without seeing the patient for an appointment). For the billing per appointment, see Billings per appointment (patient).
The sections included in this article relating to Average billings per patient are:
- Average billings and visits per patient by Practitioner
- Trend of average billings per patient
- Average visits per patient by age
- Total billings per patient
Average billings and visits per patient by Practitioner
This figure represents the average amount billed (inclusive of GST) and the average visits per individual patient broken down by Practitioner for the selected time period.
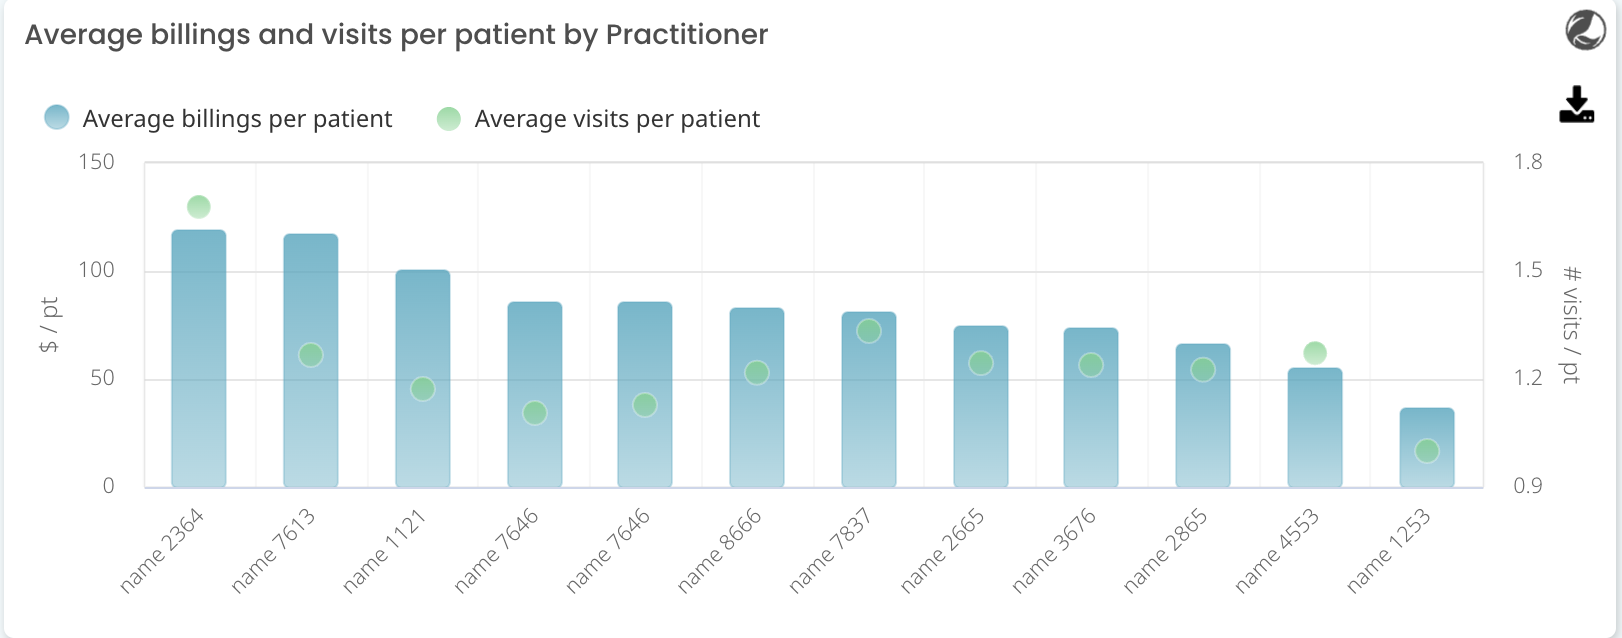
TOP TIP! Use the filters to see all the metrics on this page by an individual Practitioner, to track the trend of average billings per patient over time, for those Practitioners who run different clinics during the week i.e. Skin one day, GP, Cosmetic, etc.
Trend of average billings per patient
This figure represents the average amount billed (inclusive of GST) to each individual patient for the selected time period.
When looking at the trend graph over longer time periods, you can use the Group by drop-down box on the metric to change to view the data by day, week or month.
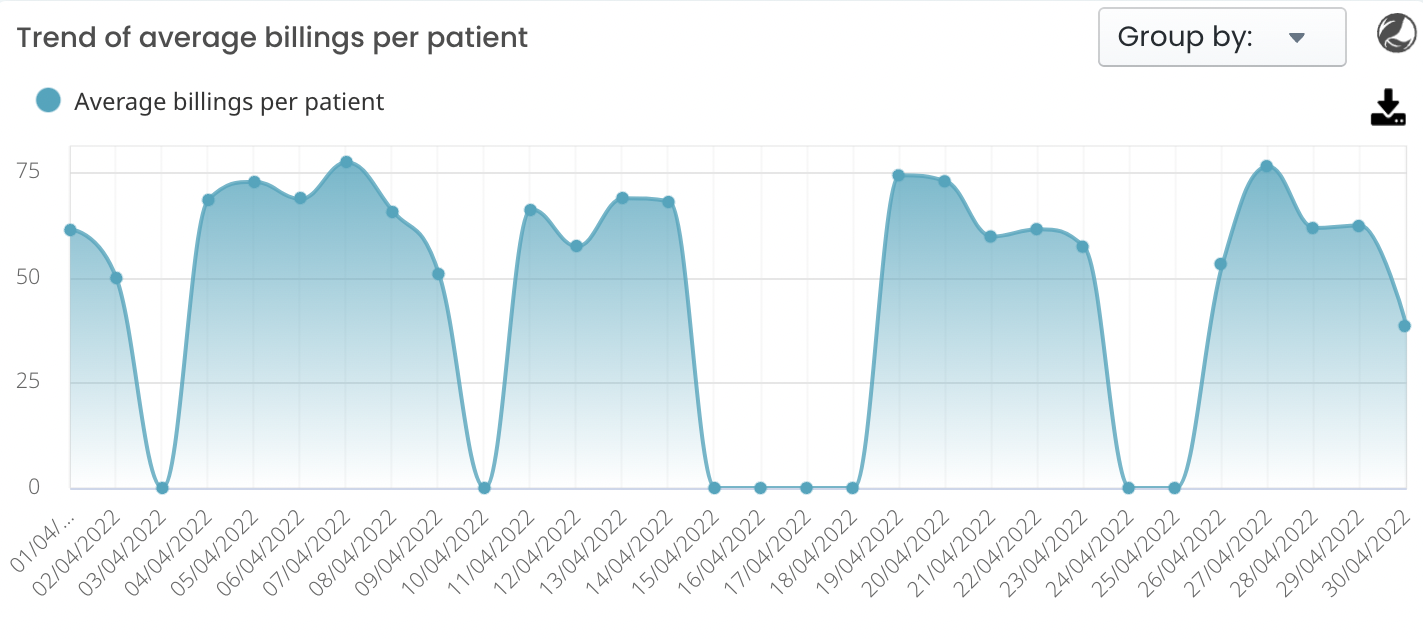
TOP TIP! Most practices are reliant on patients coming back to your Practitioners with some regularity. Using this metric, you would want to understand these trends to ensure that your average visit per patient and potentially average billings per patient are at a consistent level for your Practice.
Average visits per patient by age
This metric shows the average visits per patient by patient age group. This is based on the number of completed appointments for each patient and excludes DNAs and multiple appointments.

TOP TIP! This graph gives you insights into how your Practitioners are performing based on the ages and frequency of their patient visits. You can use the Role filter to see the differences for your doctor, nurses, allied health and specialist teams.
Total Billings per patient
This table lists the details for each patient that has been billed in the selected time period. You can see how much each patient has been billed (inclusive of GST), the number of completed appts, their most recent appt, last seen doctor and usual doctor.
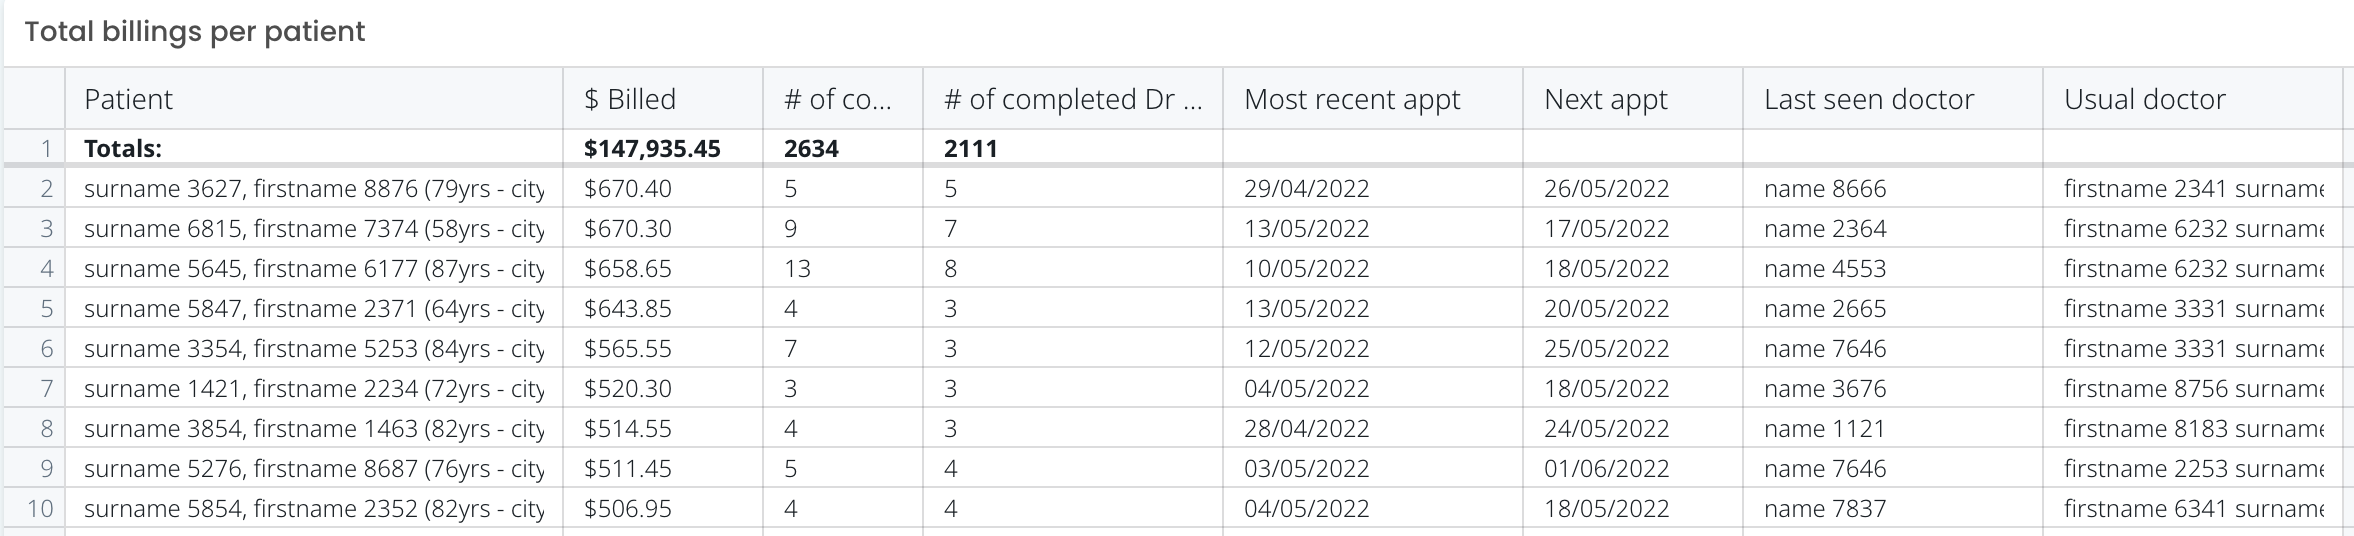
TOP TIP! Establishing and measuring your regular patient base is important. It will allow you to understand how your practice is growing, and show the effectiveness of your marketing strategies to attract and retain patients.
For example, a skin cancer clinic could use this as a means to identify frequently attending patients over the course of a month, quarter, year, etc.